Hello?
Dear traders, nice to meet you.
"Like" is a huge force for me.
By "following" you can always get new information quickly.
Thank you for always supporting me.
-------------------------------------------------- -----
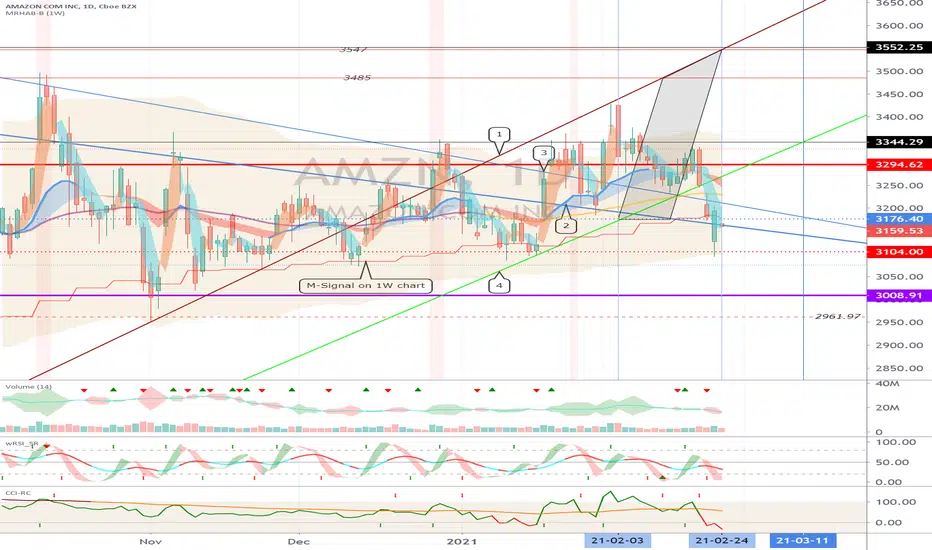
It remains to be seen if there is any movement outside the 3104.0-3176.40 range due to volatility around February 24th.
In particular, it remains to be seen if it can rise above the downtrend line (2).
If it falls at 3176.40, you need a Stop Loss to preserve your profit or loss.
However, since it is moving sideways in the large box section, 3008.91-3294.62, you need to think about the strategy for responding within this section.
Accordingly, point 3008.91 is an important point.
-----------------------------
(DJI 1D chart)
tradingview.com/chart/X5oqbP5t/
It started with a drop in the gap (31537.4-31499.8) and closed at 1.35%.
----------------------------
(IXIC 1D chart)

It started with a drop in the gap (13465.2-13400.3) and closed at 0.99%.
-------------------------------
(SPX 1D chart)

It started with a drop in the gap (3881.4-3873.7) and closed at 1.14%.
--------------------------------
(XAUUSD 1D chart)

We have to see if we can quickly climb above 1803.382 points.
The next volatility period is around March 3.
-------------------------------------
(USOIL 1D chart)

It remains to be seen if the volatility around March 1 causes any movement outside the 60.25-65.03 range.
-------------------------------------------------- -------------------------------------------
** All indicators are lagging indicators.
So, it's important to know that the indicator moves accordingly with the movement of price and volume.
Just for convenience, we are talking upside down for interpretation of the indicators.
** The wRSI_SR indicator is an indicator created by adding settings and options from the existing Stochastic RSI indicator.
Hence, the interpretation is the same as the conventional Stochastic RSI indicator. (K, D line -> R, S line)
** The OBV indicator was re-created by applying a formula from the DepthHouse Trading indicator, an indicator that oh92 disclosed. (Thank you for this.)
** Check support, resistance and abbreviation points.
** Support or resistance is based on the closing price of the 1D chart.
** All explanations are for reference only and do not guarantee profit or loss on investment.
Explanation of abbreviations displayed on the chart
R: A point or section of resistance that requires a response to preserve profits
S-L: Stop Loss point or section
S: A point or segment that can be bought for profit generation as a support point or segment
(Short-term Stop Loss can be said to be a point where profits or losses can be preserved or additionally entered through installment transactions. It is a short-term investment perspective.)
GAP refers to the difference in prices that occurred when the stock market, CME, and BAKKT exchanges were closed because they do not trade 24 hours a day.
G1: Closed price
G2: Market price at the time of opening
(Example) Gap (G1-G2)
Dear traders, nice to meet you.
"Like" is a huge force for me.
By "following" you can always get new information quickly.
Thank you for always supporting me.
-------------------------------------------------- -----
It remains to be seen if there is any movement outside the 3104.0-3176.40 range due to volatility around February 24th.
In particular, it remains to be seen if it can rise above the downtrend line (2).
If it falls at 3176.40, you need a Stop Loss to preserve your profit or loss.
However, since it is moving sideways in the large box section, 3008.91-3294.62, you need to think about the strategy for responding within this section.
Accordingly, point 3008.91 is an important point.
-----------------------------
(DJI 1D chart)
tradingview.com/chart/X5oqbP5t/
It started with a drop in the gap (31537.4-31499.8) and closed at 1.35%.
----------------------------
(IXIC 1D chart)
It started with a drop in the gap (13465.2-13400.3) and closed at 0.99%.
-------------------------------
(SPX 1D chart)
It started with a drop in the gap (3881.4-3873.7) and closed at 1.14%.
--------------------------------
(XAUUSD 1D chart)
We have to see if we can quickly climb above 1803.382 points.
The next volatility period is around March 3.
-------------------------------------
(USOIL 1D chart)
It remains to be seen if the volatility around March 1 causes any movement outside the 60.25-65.03 range.
-------------------------------------------------- -------------------------------------------
** All indicators are lagging indicators.
So, it's important to know that the indicator moves accordingly with the movement of price and volume.
Just for convenience, we are talking upside down for interpretation of the indicators.
** The wRSI_SR indicator is an indicator created by adding settings and options from the existing Stochastic RSI indicator.
Hence, the interpretation is the same as the conventional Stochastic RSI indicator. (K, D line -> R, S line)
** The OBV indicator was re-created by applying a formula from the DepthHouse Trading indicator, an indicator that oh92 disclosed. (Thank you for this.)
** Check support, resistance and abbreviation points.
** Support or resistance is based on the closing price of the 1D chart.
** All explanations are for reference only and do not guarantee profit or loss on investment.
Explanation of abbreviations displayed on the chart
R: A point or section of resistance that requires a response to preserve profits
S-L: Stop Loss point or section
S: A point or segment that can be bought for profit generation as a support point or segment
(Short-term Stop Loss can be said to be a point where profits or losses can be preserved or additionally entered through installment transactions. It is a short-term investment perspective.)
GAP refers to the difference in prices that occurred when the stock market, CME, and BAKKT exchanges were closed because they do not trade 24 hours a day.
G1: Closed price
G2: Market price at the time of opening
(Example) Gap (G1-G2)
Nota
(GME 1D chart)We need to see if we can get support from 91.63-120.88 and break above the uptrend line.
Nota
(CCIV 1D chart)Nota
(AMZN 1D chart)We have to see if we can quickly ascend above the 3104.0 point.
If it falls, we need to make sure we get support at 3008.91.
We have to see if we can continue the sideways in the big box section, 3008.91-3294.62.
The next volatility period is around March 11th.
-------------------------------
(DJI 1D chart)
It started with a drop in the gap (31961.9-31955.9) and closed at -1.75%.
---------------------------------
(IXIC 1D chart)
It started with the gap (13598.0-13512.6) falling and closed at -3.52%.
--------------------------------
(SPX 1D chart)
It started with a drop in the gap (3925.4-3915.8) and closed at -2.45%.
-----------------------------------
(XAUUSD 1D chart)
You should watch for any movement that deviates from the 1753.992-1803.382 section.
-------------------------------------
(USOIL 1D chart)
You should watch for any movement that deviates from 60.25-65.03.
In particular, it remains to be seen if it can rise along the uptrend line (2).
Nota
(AMZN 1D chart)We need to see if we can move sideways in the big box segment of 3008.91-3294.62.
If you fall from the 3008.91 point, you can touch the 2734.40 point, so you need to trade carefully.
The next volatility period is around March 11th.
※ Follow X to check out the posts.
※ X를 팔로우하고 게시물을 확인하세요.
◆ t.me/readCryptoChannel
[HA-MS Indicator]
bit.ly/3YxHgvN
[OBV Indicator]
bit.ly/4dcyny3
※ X를 팔로우하고 게시물을 확인하세요.
◆ t.me/readCryptoChannel
[HA-MS Indicator]
bit.ly/3YxHgvN
[OBV Indicator]
bit.ly/4dcyny3
Penerbitan berkaitan
Penafian
Maklumat dan penerbitan adalah tidak dimaksudkan untuk menjadi, dan tidak membentuk, nasihat untuk kewangan, pelaburan, perdagangan dan jenis-jenis lain atau cadangan yang dibekalkan atau disahkan oleh TradingView. Baca dengan lebih lanjut di Terma Penggunaan.