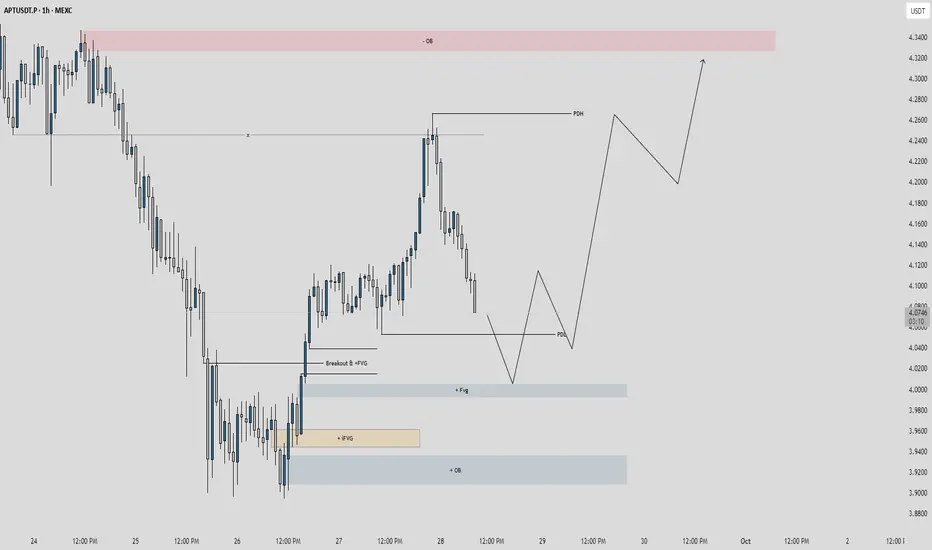
Price Action: Price broke above PDH at 4.2800 on Sep 28, showing bullish momentum, but pulled back to test support around 4.0813 (PDL).
Key Levels:
Resistance: 4.3800 (-OB, overbought zone).
Support: 4.0813 (PDL) and 4.0000 (+QB).
Zones:
Breakout +FVG: 4.0813-4.1000 (potential retest zone).
Inverted +IFVG: 3.9400-3.9600 (deeper support).
Quarter Back (+QB): 4.0000.
Trend: Bullish breakout above 4.2800, currently correcting. A hold above 4.0813 could resume the uptrend.
Long if price holds 4.0813 with confirmation target 4.2800, stop loss below 4.0600.
Dagangan ditutup: sasaran tercapai
Penafian
Maklumat dan penerbitan adalah tidak dimaksudkan untuk menjadi, dan tidak membentuk, nasihat untuk kewangan, pelaburan, perdagangan dan jenis-jenis lain atau cadangan yang dibekalkan atau disahkan oleh TradingView. Baca dengan lebih lanjut di Terma Penggunaan.
Penafian
Maklumat dan penerbitan adalah tidak dimaksudkan untuk menjadi, dan tidak membentuk, nasihat untuk kewangan, pelaburan, perdagangan dan jenis-jenis lain atau cadangan yang dibekalkan atau disahkan oleh TradingView. Baca dengan lebih lanjut di Terma Penggunaan.