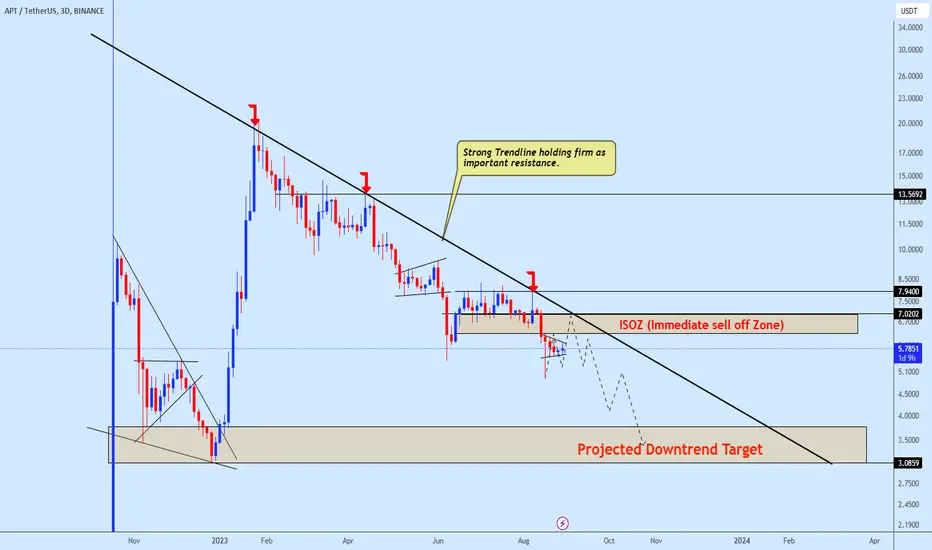
APTUSDT has been following a distinct downtrend recently, The price action, along with various technical indicators, confirms the bearish momentum. We should remain cautious, anticipating potential pullbacks or trend continuations.
The chart highlights the 'ISOZ' zone, a crucial area of interest. Price seems to be gravitating towards this zone for a potential re-test. A re-test here can provide insights into APTUSDT's next major move.
Looking forward, have pinpointed the 'Final Projected Target' on the chart. This target isn't just an area of potential price movement but also presents itself as a lucrative zone for long-term accumulation.
Do ensure to match this analysis with your personal findings, use appropriate risk management, and stay updated with any potential news events that might influence the market. If you found this analysis valuable, consider hitting the 'like' button.
Thank you.
📢Follow the official links only! Trade smart, stay safe! 🎯
Telegram: t.me/+m0IACMn0ul03OTFk
Forex zone: t.me/+piiPgrNtrulkNDk0
💎 Premium details: t.me/wcsepayment
📩 Promotion/Partnership: t.me/WESLAD
Telegram: t.me/+m0IACMn0ul03OTFk
Forex zone: t.me/+piiPgrNtrulkNDk0
💎 Premium details: t.me/wcsepayment
📩 Promotion/Partnership: t.me/WESLAD
Penafian
Maklumat dan penerbitan adalah tidak dimaksudkan untuk menjadi, dan tidak membentuk, nasihat untuk kewangan, pelaburan, perdagangan dan jenis-jenis lain atau cadangan yang dibekalkan atau disahkan oleh TradingView. Baca dengan lebih lanjut di Terma Penggunaan.
