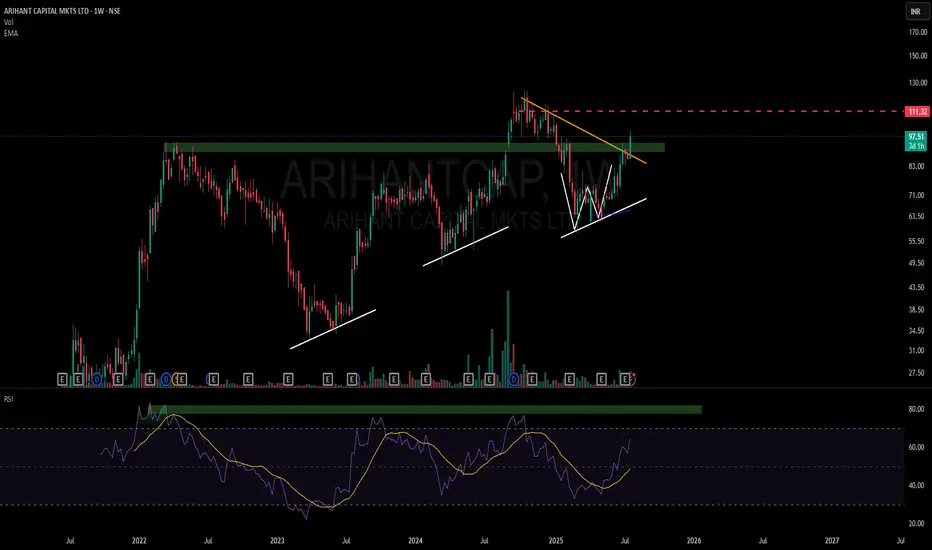
🔍 Key Observations:
- Supply ➡️ Demand Flip: The green zone previously acted as a supply region but was recently respected as demand, showcasing a classic SD conversion
- Double Bottom + Higher Lows (Structure): A W-bottom has formed on the weekly timeframe (WTF), with rising higher lows (marked in white)
- Weekly RSI Momentum: RSI has broken out of a local resistance, historically sensitive 76-80 band — a region that previously capped upside
📎 Why this matters (Learning Focus):
This chart provides a neat case study on how multiple timeframe resistance (red dotted) and structural clues such as higher lows, SD flips, and clean RSI zones
📘 Remember:
This is not a prediction — it's a framework for thinking. The goal here is to observe price behavior around critical levels, not a call or tip.
✅ Telegram ( More Charts) : t.me/hashtaghammer
✅ WhatsApp (Contact me) : wa.me/919455664601
✅ YouTube (More Content) : youtube.com/@HashtagHammer
✅ WhatsApp (Contact me) : wa.me/919455664601
✅ YouTube (More Content) : youtube.com/@HashtagHammer
Penerbitan berkaitan
Penafian
Maklumat dan penerbitan adalah tidak dimaksudkan untuk menjadi, dan tidak membentuk, nasihat untuk kewangan, pelaburan, perdagangan dan jenis-jenis lain atau cadangan yang dibekalkan atau disahkan oleh TradingView. Baca dengan lebih lanjut di Terma Penggunaan.
