Description:
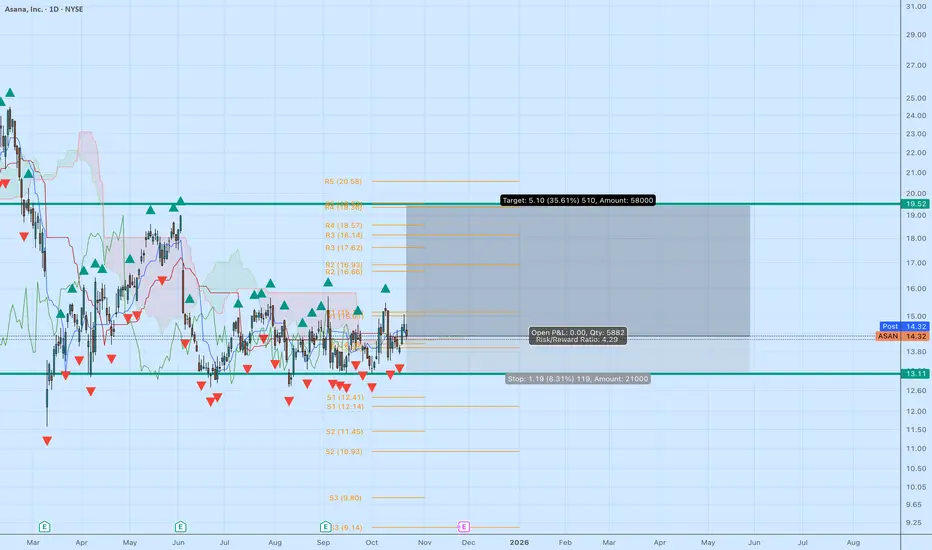
Asana (ASAN) is consolidating tightly around $14.30, coiling beneath key resistance and showing early signs of a potential breakout. Price is now sitting right at the Kijun and Tenkan cross zone, with the Ichimoku Cloud flattening and narrowing — a setup that often precedes trend expansion.
Technical Breakdown:
Ichimoku: Price testing the underside of the cloud. A clean close above $14.70–$15.00 with volume would confirm a bullish Kumo breakout. Span A is beginning to turn upward, while Lagging Span (Chikou) is approaching a clear path above price — an early bullish signal.
Support: $13.10 (base floor)
Resistance: $14.90 → $17.60 → $19.50
Stop: Below $13.00
Target Zone: $17.00 (analyst avg) → $19.50 (upper technical target)
Risk/Reward: ~4.2 : 1
RSI: Neutral at ~55 — plenty of room for expansion.
Volume: Accumulation phase showing upticks on green candles.
Analyst Consensus:
Average 12-month price target: $17.00 (+18% upside).
High-end estimates: $20–21, aligning with the top of the current resistance band.
Analysts maintain a “Hold / Modest Buy” stance, but improving enterprise adoption and potential margin expansion through AI-driven efficiency remain catalysts into 2026.
Trade Plan:
▶ Watch for a daily close above $15 to confirm breakout.
▶ Initial target $17, extended $19.50.
▶ Stop below $13.00 to protect capital.
▶ If breakout holds, consider trailing stops or layering covered calls above $19–$20.
This setup offers asymmetric reward potential for traders anticipating a late-year software rebound as sentiment shifts back toward SaaS names.
If you found my trades helpful, please consider sending a tip in BTC to: bc1qr35mrh82hykpy9v6znpsyuew85x84ezjyrrf6m
Penafian
Maklumat dan penerbitan adalah tidak dimaksudkan untuk menjadi, dan tidak membentuk, nasihat untuk kewangan, pelaburan, perdagangan dan jenis-jenis lain atau cadangan yang dibekalkan atau disahkan oleh TradingView. Baca dengan lebih lanjut di Terma Penggunaan.