The stock has successfully reached the initial target as per the previous analysis. Upon re-evaluation, further bullish potential is evident, but key resistance levels may interrupt immediate upside continuation.
1. Resistance and Potential Retracement:
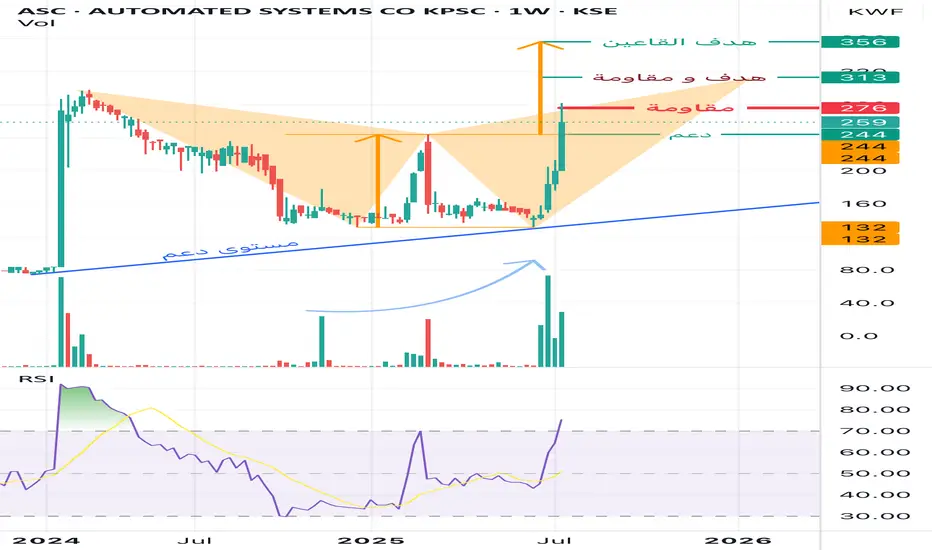
• The stock is currently facing a strong resistance at 276 KWF, which has temporarily capped the current rally.
• A pullback to the 244 KWF support level is possible, serving as a healthy retest before any renewed breakout attempt.
2. Harmonic Pattern – Shark 🦈:
• The current structure aligns with a Shark harmonic pattern, projecting a target at 313 KWF, which also coincides with a major resistance level.
• Due to this confluence, the 313 level serves both as a target and a barrier, making it a critical decision point for bulls and institutional players.
3. Double Bottom Formation (Pattern Analysis):
• A symmetrical double bottom pattern is visible, suggesting a more extended bullish outlook.
• This pattern projects a potential longer-term target at 356 KWF, which could be the area where smart money (market makers) aim to unload positions.
4. Volume and Momentum:
• Volume has shown a noticeable increase, reflecting growing market interest and accumulation.
• The RSI indicator has surged sharply but is approaching overbought territory, indicating momentum is strong, though some cooling may occur.
Consclusion
• The stock remains in a bullish structure, but is currently testing a key resistance level.
• A pullback to 244 would be technically constructive if followed by a breakout above 276.
• If 276 is breached decisively, the next objectives would be:
• Target 1 / Resistance: 313 KWF (Shark pattern)
• Target 2: 356 KWF (Double Bottom pattern)
Recommendation:
Monitor price behavior around 276. A successful breakout with volume confirmation opens the way toward 313 and beyond. A pullback to 244 can be considered a strategic re-entry opportunity within the broader bullish framework.
1. Resistance and Potential Retracement:
• The stock is currently facing a strong resistance at 276 KWF, which has temporarily capped the current rally.
• A pullback to the 244 KWF support level is possible, serving as a healthy retest before any renewed breakout attempt.
2. Harmonic Pattern – Shark 🦈:
• The current structure aligns with a Shark harmonic pattern, projecting a target at 313 KWF, which also coincides with a major resistance level.
• Due to this confluence, the 313 level serves both as a target and a barrier, making it a critical decision point for bulls and institutional players.
3. Double Bottom Formation (Pattern Analysis):
• A symmetrical double bottom pattern is visible, suggesting a more extended bullish outlook.
• This pattern projects a potential longer-term target at 356 KWF, which could be the area where smart money (market makers) aim to unload positions.
4. Volume and Momentum:
• Volume has shown a noticeable increase, reflecting growing market interest and accumulation.
• The RSI indicator has surged sharply but is approaching overbought territory, indicating momentum is strong, though some cooling may occur.
Consclusion
• The stock remains in a bullish structure, but is currently testing a key resistance level.
• A pullback to 244 would be technically constructive if followed by a breakout above 276.
• If 276 is breached decisively, the next objectives would be:
• Target 1 / Resistance: 313 KWF (Shark pattern)
• Target 2: 356 KWF (Double Bottom pattern)
Recommendation:
Monitor price behavior around 276. A successful breakout with volume confirmation opens the way toward 313 and beyond. A pullback to 244 can be considered a strategic re-entry opportunity within the broader bullish framework.
Penafian
Maklumat dan penerbitan adalah tidak bertujuan, dan tidak membentuk, nasihat atau cadangan kewangan, pelaburan, dagangan atau jenis lain yang diberikan atau disahkan oleh TradingView. Baca lebih dalam Terma Penggunaan.
Penafian
Maklumat dan penerbitan adalah tidak bertujuan, dan tidak membentuk, nasihat atau cadangan kewangan, pelaburan, dagangan atau jenis lain yang diberikan atau disahkan oleh TradingView. Baca lebih dalam Terma Penggunaan.