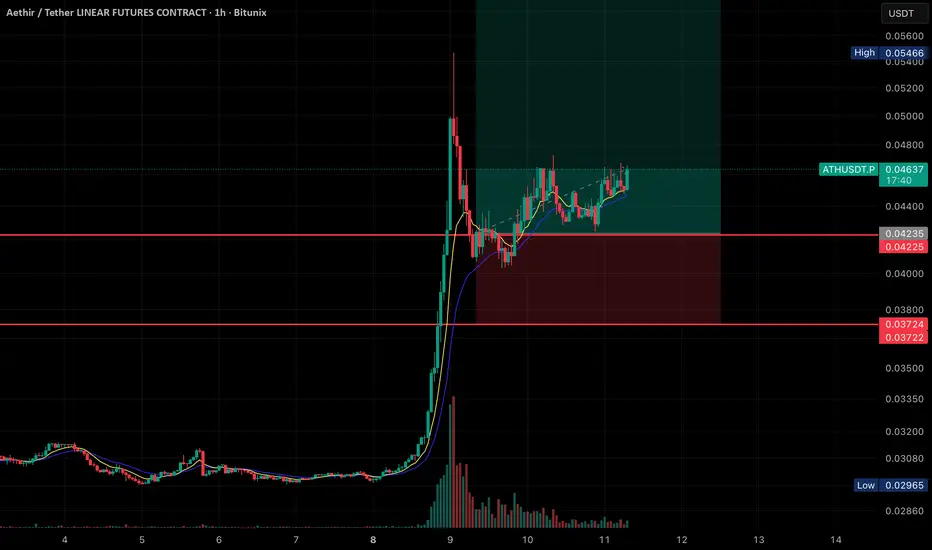
Here’s the breakdown of what’s shown:
• Price Action:
The chart shows a massive spike in price on September 8th, followed by a retracement and consolidation phase.
Currently, the price is trading at 0.04634 USDT, with slight bullish movement (+1.58%).
• Indicators:
• Moving averages (likely EMA 9 & 21) are plotted, and the price is staying above them, showing bullish support.
• Volume spiked heavily during the breakout and has since decreased while consolidation is happening.
• Trade Setup (Highlighted Zone):
• Entry: Around the current price (0.0463 USDT).
• Stop Loss: Just below 0.0422–0.0423 support zone.
• Target Zone: Extends upward past 0.054 (previous high), indicating a long trade setup with a good risk-to-reward ratio.
• Support & Resistance:
• Support 1: 0.04225 – 0.04235
• Support 2: 0.03722 – 0.03724
• Resistance: 0.05466 (recent swing high)
👉 Overall, this looks like a bullish continuation setup after a breakout, with price consolidating in a higher range before a possible push toward the recent highs
Penafian
Maklumat dan penerbitan adalah tidak bertujuan, dan tidak membentuk, nasihat atau cadangan kewangan, pelaburan, dagangan atau jenis lain yang diberikan atau disahkan oleh TradingView. Baca lebih dalam Terma Penggunaan.
Penafian
Maklumat dan penerbitan adalah tidak bertujuan, dan tidak membentuk, nasihat atau cadangan kewangan, pelaburan, dagangan atau jenis lain yang diberikan atau disahkan oleh TradingView. Baca lebih dalam Terma Penggunaan.