🔍 Technical Structure & Price Action:
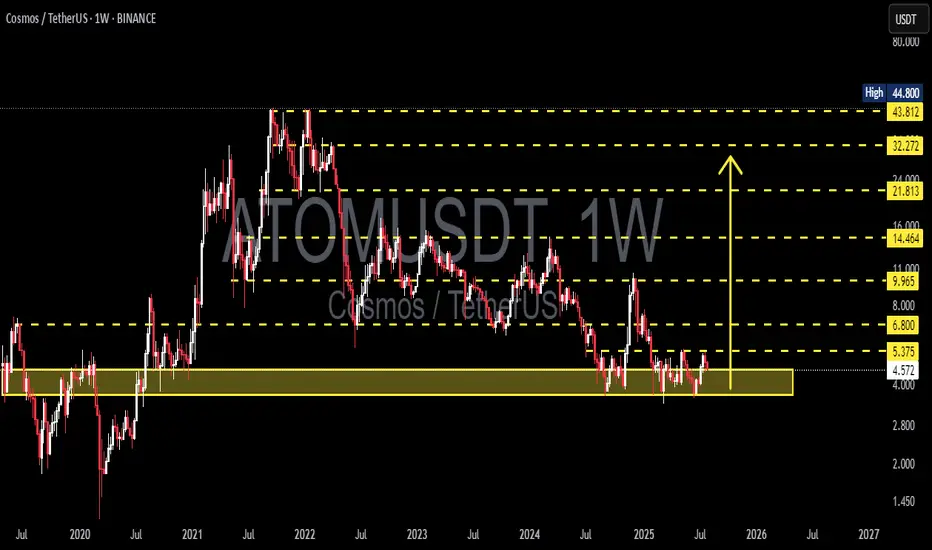
ATOM has been in a prolonged downtrend since peaking at $44.80 in 2022, forming consistent lower highs and lower lows. However, the price has recently returned to a major long-term demand zone between $4.00 – $5.37, which has historically acted as a strong support since 2020.
The price is showing a bullish reaction from this level, indicating a potential trend reversal or relief rally.
---
🧱 Key Levels & Technical Zones:
Level Role
$4.00 - $5.37 Major Historical Demand Zone (Strong Support) 🟨
$6.80 Minor Resistance & Double Bottom Neckline
$9.96 Mid-Term Key Resistance
$14.46 Next Bullish Target If Breakout Holds
$21.81 Major Resistance Ahead
$32.27 - $43.81 Long-Term Distribution Zone / ATH Range
$44.80 All-Time High (ATH)
---
📐 Patterns and Price Behavior:
🟡 1. Potential Double Bottom (Reversal Pattern)
The price appears to be forming a double bottom structure with a neckline around $6.80. A successful breakout above this level could signal a confirmed trend reversal.
🟡 2. Sideways Accumulation
ATOM has been ranging sideways within a tight zone, suggesting institutional accumulation before a possible impulse breakout.
🟡 3. Volume Compression
Declining volume near support often precedes a strong breakout move, either up or down.
---
✅ Bullish Scenario:
Price continues to hold above the $4.00 – $5.37 demand zone.
If weekly candle closes above $6.80, bullish confirmation is triggered.
Potential targets:
Short-Term: $9.96
Mid-Term: $14.46 – $21.81
Long-Term: $32.27 – $43.81 (if momentum sustains)
📈 Confirmation Signs:
Break and weekly close above $6.80
Increasing breakout volume
RSI divergence from oversold territory
---
⚠️ Bearish Scenario:
If price breaks down below $4.00, bears could regain control.
Possible downside targets:
Next Support: $2.80
Breakdown invalidates the double bottom structure
Continuation of macro downtrend likely
📉 Confirmation Signs:
Strong weekly close below $4.00
Spike in selling volume
Failure to break $6.80 resistance
---
🎯 Conclusion & Strategy:
ATOM is sitting at a make-or-break level, where a strong historical support zone meets growing bullish momentum. If bulls manage to break above $6.80, it could trigger a multi-week rally toward mid-term targets. This setup presents a high reward-to-risk opportunity if managed correctly.
---
⚙️ Trading Strategy Suggestion:
Aggressive Entry: Within $5.00 - $5.37 zone, stop loss below $4.00
Conservative Entry: After confirmed breakout above $6.80
Take-Profit Zones: $9.96 → $14.46 → $21.81
Risk Management is a MUST 🚨
#ATOMUSDT #Cosmos #CryptoAnalysis #DoubleBottom #AltcoinOutlook #TechnicalAnalysis #SupportResistance #PriceAction #CryptoTrading #BreakoutWatch #TrendReversal
✅ Get Free Signals! Join Our Telegram Channel Here: t.me/TheCryptoNuclear
✅ Twitter: twitter.com/crypto_nuclear
✅ Join Bybit : partner.bybit.com/b/nuclearvip
✅ Benefits : Lifetime Trading Fee Discount -50%
✅ Twitter: twitter.com/crypto_nuclear
✅ Join Bybit : partner.bybit.com/b/nuclearvip
✅ Benefits : Lifetime Trading Fee Discount -50%
Penafian
Maklumat dan penerbitan adalah tidak dimaksudkan untuk menjadi, dan tidak membentuk, nasihat untuk kewangan, pelaburan, perdagangan dan jenis-jenis lain atau cadangan yang dibekalkan atau disahkan oleh TradingView. Baca dengan lebih lanjut di Terma Penggunaan.