AUDCHF an awesome short opportunity.. 18 Jan and beyond.
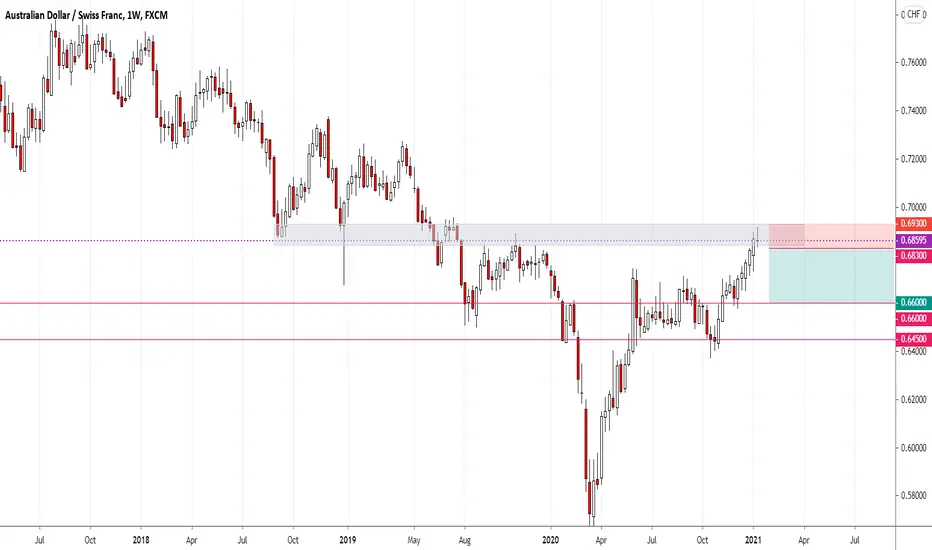
The area marked (between 0.6930 and 0.6840) has been a strong support zone since Oct 2008. In July 2019 it became resistance and has held that role multiple times since then. As my weekly chart shows, price got to this level 2 weeks ago but last week it stalled here and we see a doji formation (indecision). I expect this resistance to hold and bearish PA to follow in the coming week.
I will enter a short below the low of last week candle with stop above its high. My initial target will be just above 0.6600 level with potential to go much lower. This is a weekly trade and patience is essential to see it through.
However, a break above the high of the indecision candle will negate my analysis.
If you like my analysis, please give it a “thumbs up“ and follow me to get immediate notifications.
As always, please use sound money and risk management in all your trades.
Nota
I am still in this trade, the rise in price was concerning, but seems to be moving in my direction now.Penafian
Maklumat dan penerbitan adalah tidak dimaksudkan untuk menjadi, dan tidak membentuk, nasihat untuk kewangan, pelaburan, perdagangan dan jenis-jenis lain atau cadangan yang dibekalkan atau disahkan oleh TradingView. Baca dengan lebih lanjut di Terma Penggunaan.
Penafian
Maklumat dan penerbitan adalah tidak dimaksudkan untuk menjadi, dan tidak membentuk, nasihat untuk kewangan, pelaburan, perdagangan dan jenis-jenis lain atau cadangan yang dibekalkan atau disahkan oleh TradingView. Baca dengan lebih lanjut di Terma Penggunaan.