The AUD/JPY pair gained a strong bullish boost after higher-than-expected Australian consumer inflation data, which dampened speculation of an interest rate cut by the Reserve Bank of Australia (RBA). Currently, the price is at a new weekly high and awaits confirmation of a breakout.
1. Market Fundamental Factors (Drivers of the Upside)
Higher Australian Inflation: The hotter (higher) Australian consumer inflation figures dampened market bets for further interest rate cuts by the RBA.
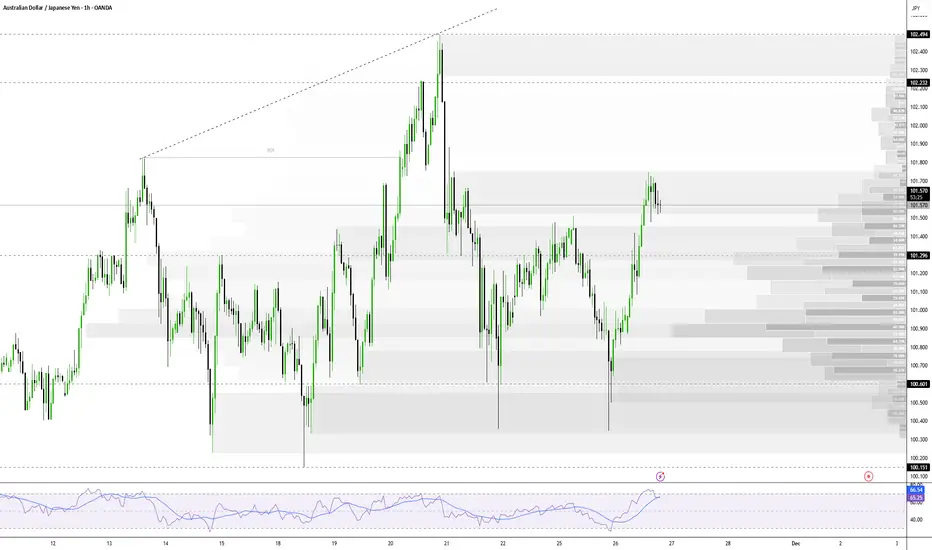
Impact: This significantly boosted the Australian Dollar (AUD), lifting the AUD/JPY pair to the 101.70 area (a new weekly high).
2. Technical Analysis and Indicators
Long-Term Bias: The 100-day Simple Moving Average (SMA) is rising steadily, and the price is holding above it, reinforcing the bullish bias.
Trend Conditions: Trend conditions will remain favorable as long as the price is above the rising SMA, which is currently below 98.00.
3. Bullish Scenario ⬆️
Strong Upside Trigger: Bulls await a breakout through the nearly three-week-old trading range (currently around 101.70). A decisive MACD push into positive territory would strengthen this case.
Next Target: A move will head towards the 102.45-102.50 region, or the highest level since July 2024, touched last week.
4. Bearish Scenario ⬇️
Initial Key Support: Weakness below the 101.40 area is likely to find decent support near the 101.00 round number.
Trading Range Support: A break below 101.00 could retest the trading range support around the 100.40-100.35 region.
Bias Reversal: A convincing break below 100.35 could trigger technical selling and drag the price below the psychological 100.00 mark, towards the next relevant support near the 99.65 - 99.60 region.
1. Market Fundamental Factors (Drivers of the Upside)
Higher Australian Inflation: The hotter (higher) Australian consumer inflation figures dampened market bets for further interest rate cuts by the RBA.
Impact: This significantly boosted the Australian Dollar (AUD), lifting the AUD/JPY pair to the 101.70 area (a new weekly high).
2. Technical Analysis and Indicators
Long-Term Bias: The 100-day Simple Moving Average (SMA) is rising steadily, and the price is holding above it, reinforcing the bullish bias.
Trend Conditions: Trend conditions will remain favorable as long as the price is above the rising SMA, which is currently below 98.00.
3. Bullish Scenario ⬆️
Strong Upside Trigger: Bulls await a breakout through the nearly three-week-old trading range (currently around 101.70). A decisive MACD push into positive territory would strengthen this case.
Next Target: A move will head towards the 102.45-102.50 region, or the highest level since July 2024, touched last week.
4. Bearish Scenario ⬇️
Initial Key Support: Weakness below the 101.40 area is likely to find decent support near the 101.00 round number.
Trading Range Support: A break below 101.00 could retest the trading range support around the 100.40-100.35 region.
Bias Reversal: A convincing break below 100.35 could trigger technical selling and drag the price below the psychological 100.00 mark, towards the next relevant support near the 99.65 - 99.60 region.
Penerbitan berkaitan
Penafian
The information and publications are not meant to be, and do not constitute, financial, investment, trading, or other types of advice or recommendations supplied or endorsed by TradingView. Read more in the Terms of Use.
Penerbitan berkaitan
Penafian
The information and publications are not meant to be, and do not constitute, financial, investment, trading, or other types of advice or recommendations supplied or endorsed by TradingView. Read more in the Terms of Use.