AUD/JPY (2-hour timeframe), here’s a breakdown of what’s visible
AUD/JPY (2-hour timeframe), here’s a breakdown of what’s visible:
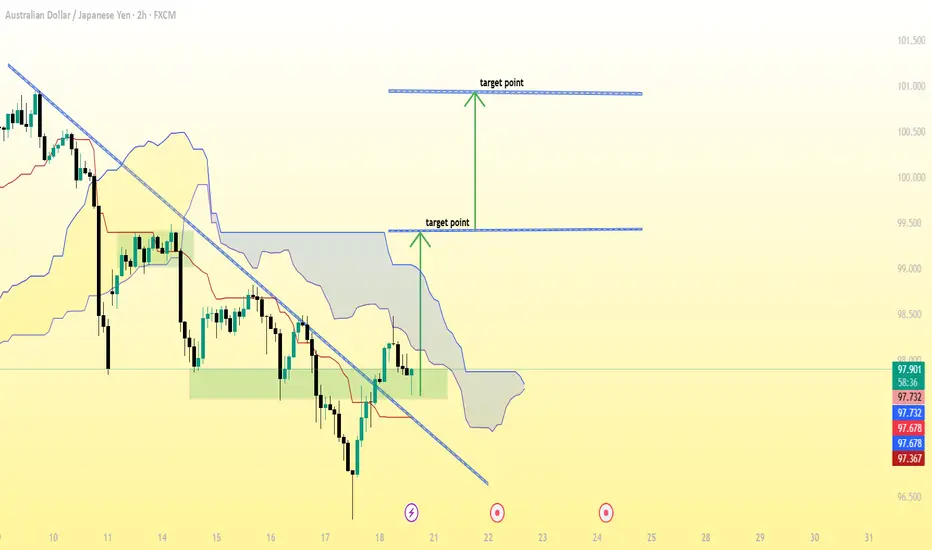
The downtrend line has been broken to the upside, suggesting a potential bullish reversal.
The Ichimoku Cloud shows price moving above or attempting to move above the cloud — another bullish signal.
Two target points are already marked on my chart:
1. First target: around 99.50
2. Second (final) target: around 100.75–101.00
✅ Summary of Target Zones:
🎯 Target 1: ~99.50
🎯 Target 2: ~100.75–101.00
📉 Stop Loss Suggestion:
My might place it just below the recent support or below the cloud (around 97.00–97.20 zone), depending on my risk tolerance.
Dagangan aktif
active activeDagangan ditutup: sasaran tercapai
1st target done Penerbitan berkaitan
Penafian
Maklumat dan penerbitan adalah tidak bertujuan, dan tidak membentuk, nasihat atau cadangan kewangan, pelaburan, dagangan atau jenis lain yang diberikan atau disahkan oleh TradingView. Baca lebih dalam Terma Penggunaan.
Penerbitan berkaitan
Penafian
Maklumat dan penerbitan adalah tidak bertujuan, dan tidak membentuk, nasihat atau cadangan kewangan, pelaburan, dagangan atau jenis lain yang diberikan atau disahkan oleh TradingView. Baca lebih dalam Terma Penggunaan.