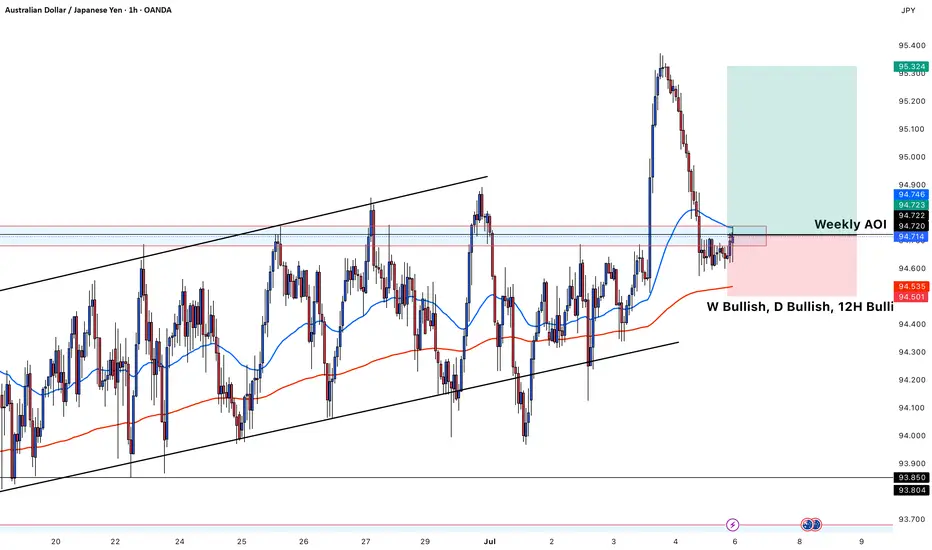
This chart shows a **buy setup on AUD/JPY** based on multi-timeframe bullish confluence and a key structure level. Here's a breakdown of the idea:
---
### 🟢 **Trade Type:** Buy
### 📈 Pair: AUD/JPY (1H Chart)
---
### ✅ **Technical Confluences:**
* **Trend Bias:**
* **Weekly (W): Bullish**
* **Daily (D): Bullish**
* **12H: Bullish**
* **Structure:**
* Price retraced into a **Weekly Area of Interest (AOI)** marked in blue and red zone.
* It bounced off the lower trendline of the ascending channel.
* Price is currently forming higher lows near the support of the AOI.
* **Indicators:**
* The **50 EMA (blue)** and **200 EMA (red)** are holding as dynamic support, especially the 200 EMA just below current price.
* EMAs show bullish alignment (short-term EMA above long-term EMA).
* **Candle Action:**
* Price rejected the AOI and is trying to push higher.
* The bullish engulfing near the EMA zone confirms buy interest.
---
### 🟦 **Entry Zone:**
* Around **94.70–94.72**, aligned with the Weekly AOI and just above 200 EMA.
### 📍 Stop Loss:
* Below the red support zone, around **94.50–94.53**, under 200 EMA and key rejection wick.
### 🎯 Take Profit:
* Around **95.30–95.32**, targeting the previous swing high for a favorable risk-reward ratio.
---
### 📊 Summary:
This is a bullish continuation trade, buying from a retracement into a strong support zone with higher timeframe bullish structure and clear confirmation through price action and EMA alignment.
---
### 🟢 **Trade Type:** Buy
### 📈 Pair: AUD/JPY (1H Chart)
---
### ✅ **Technical Confluences:**
* **Trend Bias:**
* **Weekly (W): Bullish**
* **Daily (D): Bullish**
* **12H: Bullish**
* **Structure:**
* Price retraced into a **Weekly Area of Interest (AOI)** marked in blue and red zone.
* It bounced off the lower trendline of the ascending channel.
* Price is currently forming higher lows near the support of the AOI.
* **Indicators:**
* The **50 EMA (blue)** and **200 EMA (red)** are holding as dynamic support, especially the 200 EMA just below current price.
* EMAs show bullish alignment (short-term EMA above long-term EMA).
* **Candle Action:**
* Price rejected the AOI and is trying to push higher.
* The bullish engulfing near the EMA zone confirms buy interest.
---
### 🟦 **Entry Zone:**
* Around **94.70–94.72**, aligned with the Weekly AOI and just above 200 EMA.
### 📍 Stop Loss:
* Below the red support zone, around **94.50–94.53**, under 200 EMA and key rejection wick.
### 🎯 Take Profit:
* Around **95.30–95.32**, targeting the previous swing high for a favorable risk-reward ratio.
---
### 📊 Summary:
This is a bullish continuation trade, buying from a retracement into a strong support zone with higher timeframe bullish structure and clear confirmation through price action and EMA alignment.
Penafian
Maklumat dan penerbitan adalah tidak dimaksudkan untuk menjadi, dan tidak membentuk, nasihat untuk kewangan, pelaburan, perdagangan dan jenis-jenis lain atau cadangan yang dibekalkan atau disahkan oleh TradingView. Baca dengan lebih lanjut di Terma Penggunaan.
Penafian
Maklumat dan penerbitan adalah tidak dimaksudkan untuk menjadi, dan tidak membentuk, nasihat untuk kewangan, pelaburan, perdagangan dan jenis-jenis lain atau cadangan yang dibekalkan atau disahkan oleh TradingView. Baca dengan lebih lanjut di Terma Penggunaan.