Technical Study: Bearish Marubozu within Lower Low Trend
In the current market context, we can observe:
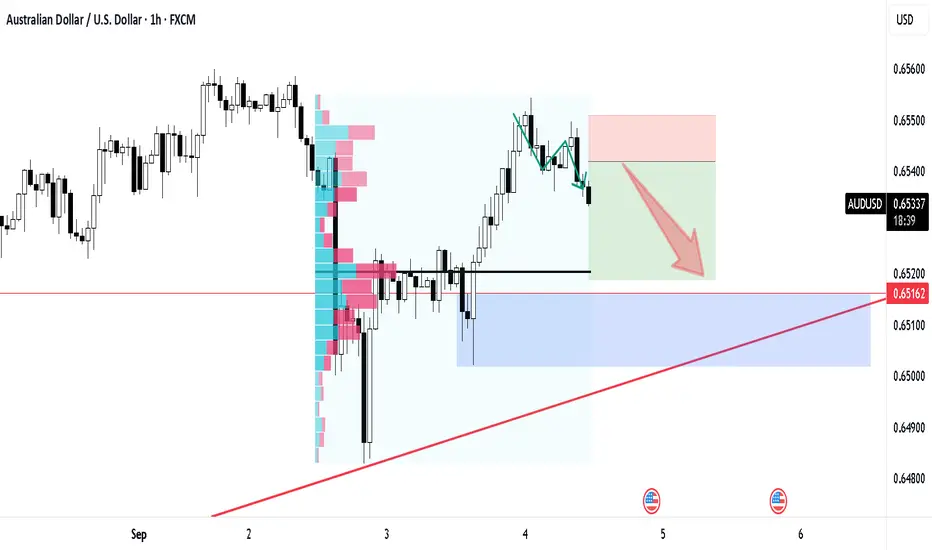
A Lower Low structure, which reflects continuous bearish momentum.
A Bearish Marubozu candle on H1, indicating strong selling pressure with minimal rejection.
Both of these technical elements suggest that the market environment is currently leaning toward bearish conditions.
===============================================
Example of Trading Plan (for Educational Purposes)
Entry & Stop Loss
Example entry considered at the 50% retracement level of the H1 Bearish Marubozu.
Example Stop Loss (SL) placed just above the Marubozu high.
Approximate SL distance: 9 pips.
Take Profit (TP)
A sample Risk : Reward ratio of 1 : 2.5 is applied.
The TP is aligned with a visible base/support zone below, which could act as a reaction area.
With a 9-pip SL, the TP projection would be around 22–23 pips.
===============================================
Key Takeaway
This setup is an example of how to combine candlestick structure with market trend analysis and apply risk management through risk–reward planning. The focus is on discipline in execution, not prediction.
===============================================
Disclaimer:
This analysis is for educational purposes only and does not constitute a recommendation to buy or sell. It is intended to demonstrate how money management and setup structures can be applied. Risk of loss exists, as well as potential for profit.
Pesanan dibatalkan
Price continue dropping. At the moment I cancel the idea. Nota
Tonight we have High Impact news.Penafian
Maklumat dan penerbitan adalah tidak dimaksudkan untuk menjadi, dan tidak membentuk, nasihat untuk kewangan, pelaburan, perdagangan dan jenis-jenis lain atau cadangan yang dibekalkan atau disahkan oleh TradingView. Baca dengan lebih lanjut di Terma Penggunaan.
Penafian
Maklumat dan penerbitan adalah tidak dimaksudkan untuk menjadi, dan tidak membentuk, nasihat untuk kewangan, pelaburan, perdagangan dan jenis-jenis lain atau cadangan yang dibekalkan atau disahkan oleh TradingView. Baca dengan lebih lanjut di Terma Penggunaan.