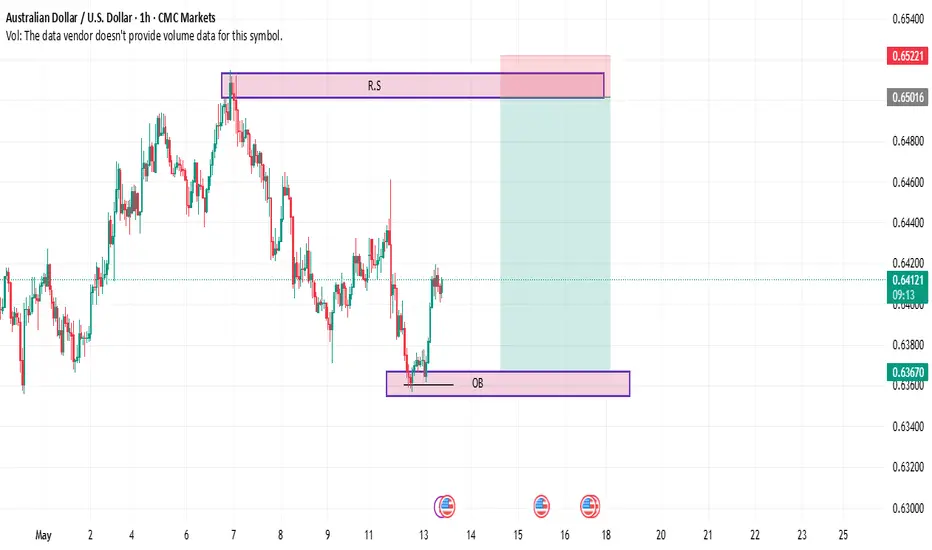
In this 1-hour chart of AUD/USD, we observe a well-defined **Order Block (OB)** at the lower level, acting as a potential demand zone, while a prominent **Resistance/Supply (R.S)** zone appears at the top. The pair recently bounced off the OB area, showing signs of a potential upward move towards the R.S zone. The highlighted green area represents the potential profit zone, while the red zone marks a risk area.
With the recent price action hinting at bullish momentum, traders should watch for reactions around the R.S level to assess whether the trend continues or reverses. Maintaining a balanced risk management strategy is essential in this setup.
With the recent price action hinting at bullish momentum, traders should watch for reactions around the R.S level to assess whether the trend continues or reverses. Maintaining a balanced risk management strategy is essential in this setup.
Penafian
Maklumat dan penerbitan adalah tidak dimaksudkan untuk menjadi, dan tidak membentuk, nasihat untuk kewangan, pelaburan, perdagangan dan jenis-jenis lain atau cadangan yang dibekalkan atau disahkan oleh TradingView. Baca dengan lebih lanjut di Terma Penggunaan.
Penafian
Maklumat dan penerbitan adalah tidak dimaksudkan untuk menjadi, dan tidak membentuk, nasihat untuk kewangan, pelaburan, perdagangan dan jenis-jenis lain atau cadangan yang dibekalkan atau disahkan oleh TradingView. Baca dengan lebih lanjut di Terma Penggunaan.