🔍 Key Levels
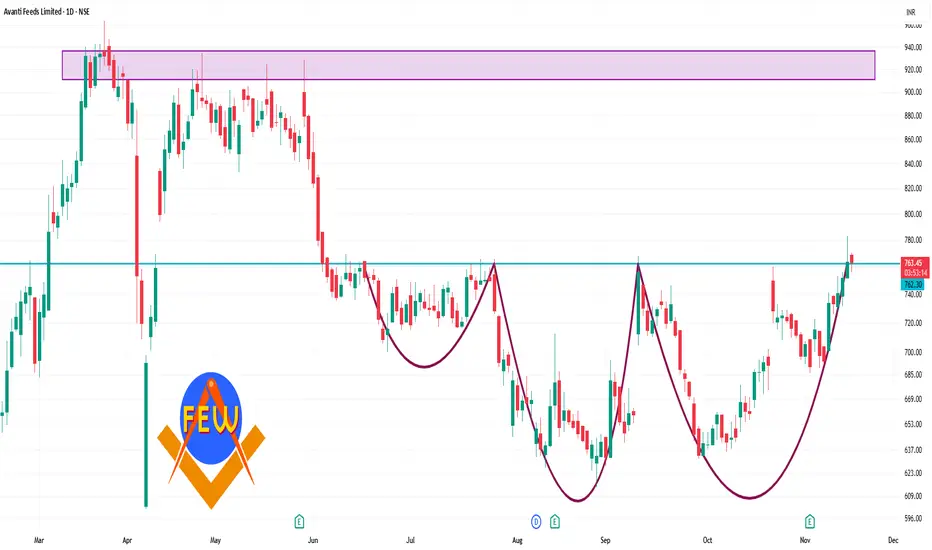
Pivot (Daily): ~ ₹ 746.47
Resistance levels:
R1 ~ ₹ 761.48
R2 ~ ₹ 770.92
R3 ~ ₹ 785.93
Support levels:
S1 ~ ₹ 737.03
S2 ~ ₹ 722.02
S3 ~ ₹ 712.58
✅ Interpretation & Use
If price holds above ~₹ 746.47 and shows strength, the next meaningful resistance zone is ~ ₹ 761-771.
If price drops below the pivot, then supports around ~ ₹ 737, and further down ~ ₹ 722 or ~ ₹ 712 become relevant.
The momentum indicators (RSI ~67.6, MACD positive) suggest bullish bias but note: when RSI gets high → risk of pull-back increases.
Penerbitan berkaitan
Penafian
Maklumat dan penerbitan adalah tidak bertujuan, dan tidak membentuk, nasihat atau cadangan kewangan, pelaburan, dagangan atau jenis lain yang diberikan atau disahkan oleh TradingView. Baca lebih dalam Terma Penggunaan.
Penerbitan berkaitan
Penafian
Maklumat dan penerbitan adalah tidak bertujuan, dan tidak membentuk, nasihat atau cadangan kewangan, pelaburan, dagangan atau jenis lain yang diberikan atau disahkan oleh TradingView. Baca lebih dalam Terma Penggunaan.