Weekly Structure:
Daily Structure (Micro View):
Indicators:
When is the Uptrend Negated?
Indicators check:
Summary Bullish Path:
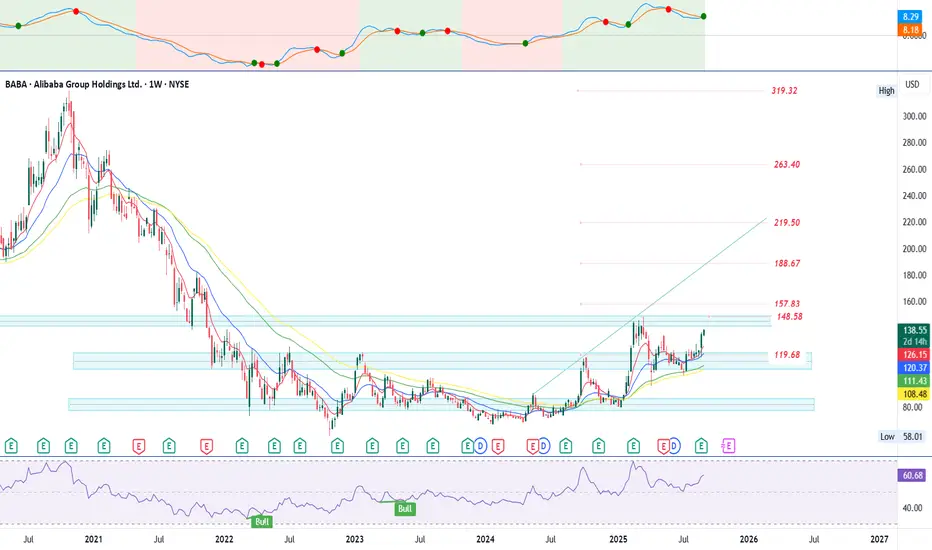
- BABA has broken out of a multi-year base between $100–$126, clearing resistance that capped rallies for almost 2 years.
- Price is now targeting the next major resistance levels:
- $148.5 → prior high and Fib cluster.
- $157.8 (Fib 0.382 retracement).
- Medium-term upside could extend to $188.6 if momentum sustains.
Daily Structure (Micro View):
- Strong breakout candle above $127–$130 confirms bulls in control.
- Immediate supports now flip bullish: $127, $123.5, and $120.
- Trend alignment: short, mid, and long EMAs are stacked positively (classic trend confirmation).
Indicators:
- PMO (Price Momentum Oscillator, top grid): Both signal lines are rising and staying in the green zone → momentum remains bullish.
- RSI (bottom grid): Currently at 63, strong but not overbought. Shows room for continuation toward 70–75 before risk of pullback.
When is the Uptrend Negated?
- The bullish thesis holds as long as price respects the breakout structure:
- Invalidation: Loss of $120 (Fib 0.236 + EMA cluster) would flip structure bearish again and re-open risk to $111–108 support.
Indicators check:
- If PMO turns down with a red signal cross, momentum is exhausted.
- If RSI fails to hold 50 on a pullback, uptrend strength is negated.
Summary Bullish Path:
- Holding above $123–$126 keeps bulls in full control.
- Upside targets: $148 → $157 → $188.
- Uptrend is negated only on a decisive break below $120 with PMO + RSI confirming weakness.
Penafian
Maklumat dan penerbitan adalah tidak dimaksudkan untuk menjadi, dan tidak membentuk, nasihat untuk kewangan, pelaburan, perdagangan dan jenis-jenis lain atau cadangan yang dibekalkan atau disahkan oleh TradingView. Baca dengan lebih lanjut di Terma Penggunaan.
Penafian
Maklumat dan penerbitan adalah tidak dimaksudkan untuk menjadi, dan tidak membentuk, nasihat untuk kewangan, pelaburan, perdagangan dan jenis-jenis lain atau cadangan yang dibekalkan atau disahkan oleh TradingView. Baca dengan lebih lanjut di Terma Penggunaan.