Retracement Within an Ascending Channel
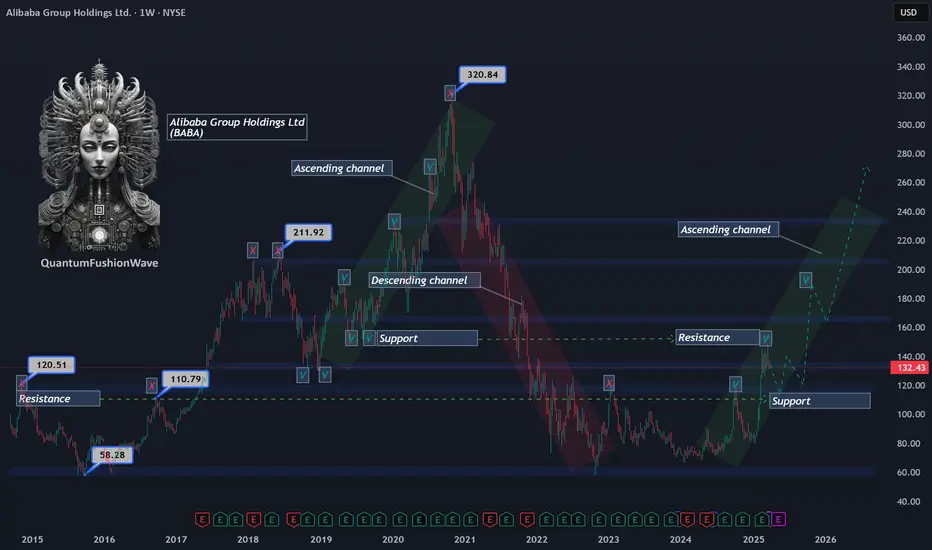
Alibaba (BABA) has faced strong supply pressure at $149, a key price level that previously acted as support in 2019 and has now flipped into resistance. The inability to reclaim this level has triggered a retracement, with the stock currently trading around $132, showing signs of continued corrective movement.
Despite the short-term weakness, BABA remains within a developing ascending channel, suggesting a potential higher timeframe bullish structure. If the retracement extends, the next significant level to watch is $110, a historical 2016 resistance level that could now act as a demand zone. A strong reaction and rejection from this level would reinforce the validity of the ascending channel and increase the probability of a trend continuation toward previous all-time highs.
Key Levels to Watch:
Resistance: $149 (2019 support turned resistance)
Current Price: $132 (active retracement zone)
Support Levels:
$110 – Historical resistance from 2016, potential demand zone
$100 – Psychological level, further downside risk
Traders should monitor price action around these key levels, as a confirmed breakdown below $110 could invalidate the channel and shift market structure to a more bearish outlook, while a strong bounce could provide a high-probability long setup within the channel’s framework.
Penafian
Maklumat dan penerbitan adalah tidak dimaksudkan untuk menjadi, dan tidak membentuk, nasihat untuk kewangan, pelaburan, perdagangan dan jenis-jenis lain atau cadangan yang dibekalkan atau disahkan oleh TradingView. Baca dengan lebih lanjut di Terma Penggunaan.
Penafian
Maklumat dan penerbitan adalah tidak dimaksudkan untuk menjadi, dan tidak membentuk, nasihat untuk kewangan, pelaburan, perdagangan dan jenis-jenis lain atau cadangan yang dibekalkan atau disahkan oleh TradingView. Baca dengan lebih lanjut di Terma Penggunaan.