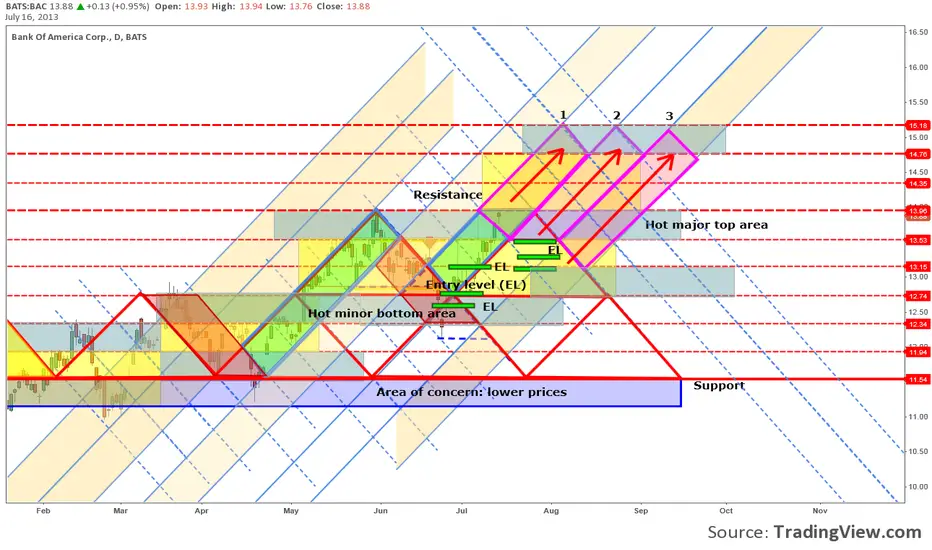
I wanted the chart to provide as many informations as possible and to be able to trade with no other indicators or charting tools at all. I wanted a view on entries/exits, trendlines, minor & majors supports/resistance horizonal & oblique., trend reversal, etc.
My interpretations of the chart at this moment: the price needs to stay above $13.15 level to go higher at $15.18.
A pullback at $13.53 would be nice to maintain the established trend and reach the point 1.
My interpretations of the chart at this moment: the price needs to stay above $13.15 level to go higher at $15.18.
A pullback at $13.53 would be nice to maintain the established trend and reach the point 1.
Penafian
Maklumat dan penerbitan adalah tidak dimaksudkan untuk menjadi, dan tidak membentuk, nasihat untuk kewangan, pelaburan, perdagangan dan jenis-jenis lain atau cadangan yang dibekalkan atau disahkan oleh TradingView. Baca dengan lebih lanjut di Terma Penggunaan.
Penafian
Maklumat dan penerbitan adalah tidak dimaksudkan untuk menjadi, dan tidak membentuk, nasihat untuk kewangan, pelaburan, perdagangan dan jenis-jenis lain atau cadangan yang dibekalkan atau disahkan oleh TradingView. Baca dengan lebih lanjut di Terma Penggunaan.