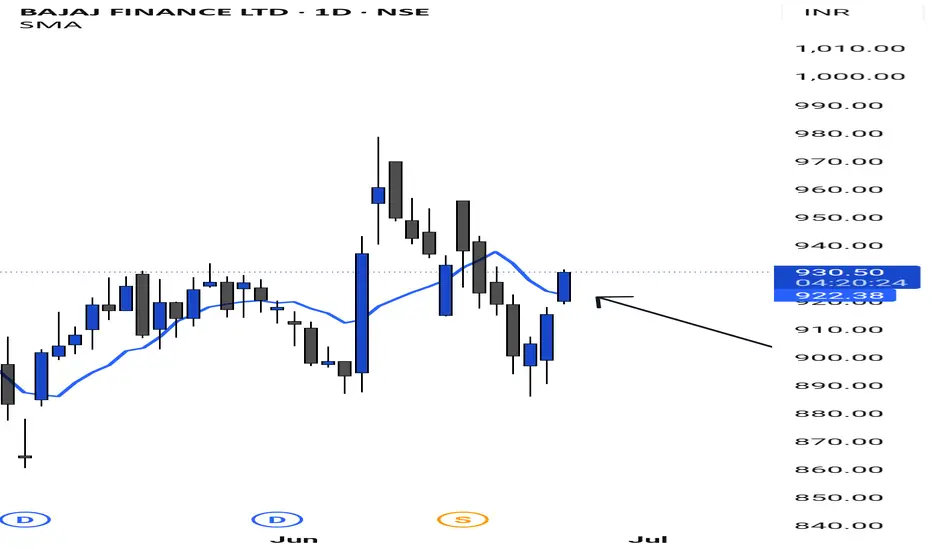
🔥 A Simple Strategy That Works: 9 SMA + Market Structure:
Over the last 18 years in the markets, I’ve noticed one common pattern among struggling traders—they jump from strategy to strategy, get caught up in countless indicators, and lose sight of the basics. The truth is, simplicity wins. And the most powerful tool you can master?
👉 Market Structure.
✅ Market Structure 101:
Uptrend: Higher Highs (HH) + Higher Lows (HL)
Downtrend: Lower Highs (LH) + Lower Lows (LL)
Sideways: Ranging or consolidating zones
Once you understand this, trading becomes more visual and logical. And to complement this understanding, I recommend one tool that works across all timeframes:
🔄 The 9 SMA Strategy (Simple Moving Average)
This is not a magic trick—it’s a clean, effective way to stay in sync with the trend. When used with multiple timeframes (Monthly, Weekly, Daily), it becomes a strong confirmation tool.
Let’s take Tata Motors as an example:
📈 Monthly Chart:
Trading above the 9 SMA
Near psychological level ₹1000
Had a rally 3–4 months ago, now consolidating
Not a confirmed breakdown yet – monthly is still holding structure
📊 Weekly Chart:
Just crossing above 9 SMA
Indicates strength building back up
📉 Daily Chart:
Also crossing 9 SMA
Shows possible trend continuation
✅ Double confirmation from Daily + Weekly
➡️ This signals potential swing or positional trade setup
🎯 Key Takeaways:
Follow the Market Structure
Understand HH-HL or LH-LL formations before jumping into trades.
Use the 9 SMA on multiple timeframes
Let smaller timeframes guide the early signs of trend shifts
Avoid complexity
Stick to one simple method and master it.
Risk Management
Never invest all at once.
If you have ₹1,00,000, break it into 4 or 5 parts.
This reduces emotional pressure and helps you stay objective.
📌 Final Thoughts:
Swing and positional trading doesn’t have to be overwhelming. Keep your tools simple, your analysis structured, and your emotions in check.
I have also curated a list of 50 highly liquid F&O stocks based on beta, volatility, volume, and liquidity. If you'd like access to that list, just drop a comment or message, and I’ll be happy to share it with you.
Keep it simple. Stay consistent.
The market rewards discipline, not complexity.
Penafian
Maklumat dan penerbitan adalah tidak dimaksudkan untuk menjadi, dan tidak membentuk, nasihat untuk kewangan, pelaburan, perdagangan dan jenis-jenis lain atau cadangan yang dibekalkan atau disahkan oleh TradingView. Baca dengan lebih lanjut di Terma Penggunaan.
Penafian
Maklumat dan penerbitan adalah tidak dimaksudkan untuk menjadi, dan tidak membentuk, nasihat untuk kewangan, pelaburan, perdagangan dan jenis-jenis lain atau cadangan yang dibekalkan atau disahkan oleh TradingView. Baca dengan lebih lanjut di Terma Penggunaan.
