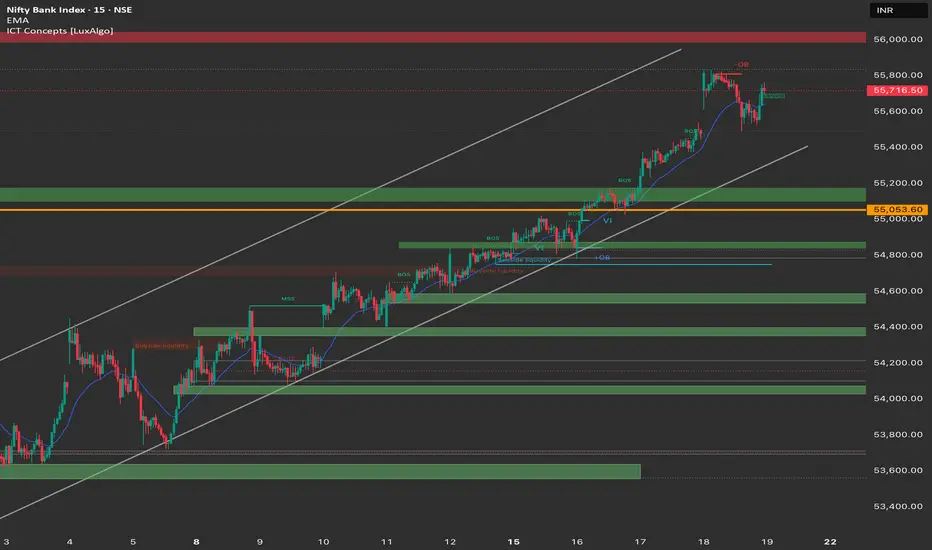
Current BANKNIFTY (Yesterday's Close): 55,716.50
Overarching Theme: Bank Nifty is in a strong and impulsive uptrend, having recovered significantly from its recent lows. It's now facing a major supply zone, which could lead to either a decisive breakout or a short-term correction.
Detailed Market Structure Breakdown
4-Hour Chart (Macro Trend)
Structure: A powerful bullish rally is in play. Bank Nifty has broken a key market structure and is now moving within a steep ascending channel. The price action shows a clear sequence of higher highs and higher lows.
Key Levels:
Major Supply Zone (Resistance): 55,800 - 56,000. This is a formidable Order Block (OB) and a prior high that has been a significant barrier. A breakout here would be a major bullish signal.
Major Demand Zone (Support): 55,050 - 55,200. This zone is a confluence of a prior breakout resistance, a FVG, and a psychological round number, making it a critical support level.
Outlook: The macro structure is very bullish. The recent impulsive move has brought the index to a crucial resistance. A pullback to the 55,050 zone would be a healthy test of support.
1-Hour Chart (Intermediate View)
Structure: The 1H chart mirrors the 4H, showing a strong impulsive move up. The price has recently tested the overhead supply zone and shown a minor rejection, indicated by the recent high and the subsequent wick.
Key Levels:
Immediate Resistance: The high around 55,800.
Immediate Support: The lower trendline of the channel, currently around 55,400.
Outlook: The 1H chart suggests the rally is near-term exhausted and a pause or a minor pullback is likely. The price must defend the lower channel support to maintain its bullish momentum.
15-Minute Chart (Intraday View)
Structure: The 15M chart provides the clearest picture of the recent price action. The market has made a "Break of Structure" (BOS) upwards, but is now showing a short-term corrective pullback from the high. This is indicated by the price trading below the blue EMA and moving lower.
Key Levels:
Intraday Supply Zone: The high around 55,800.
Intraday Demand Zone: The bottom of the current trend at 55,500. This area aligns with the blue EMA and is the first key support to watch.
Outlook: Intraday, the bias is slightly neutral-to-bearish as the market is correcting. The key will be whether the 55,500 level holds.
📈 Today's Trade Plan (Friday, 19th September)
Market Outlook: Bank Nifty is at a make-or-break point. After a strong rally, it is now testing a major resistance level. The upcoming move will be decided by whether it breaks out or pulls back to re-test support.
Bullish Scenario (Primary Plan)
Justification: The multi-timeframe trend is overwhelmingly bullish. Any pullback is likely to be a short-lived retracement before the next leg up. A breakout would be the most powerful signal.
Entry: Place a long entry on a decisive break and 15-minute candle close above the 55,800 resistance zone.
Stop Loss (SL): Below 55,700 or the low of the breakout candle.
Targets:
T1: 56,000 (Psychological target and next major level).
T2: 56,200 (Further extension of the rally).
Bearish Scenario (Secondary Plan)
Justification: This plan is for a counter-trend trade, based on the rejection from the major supply zone and the current 15M corrective structure.
Trigger: A sustained move and 15-minute candle close below the immediate support at 55,500.
Entry: Short entry on a breakdown retest of the 55,500 level.
Stop Loss (SL): Above 55,600 to protect against a fakeout.
Targets:
T1: 55,400 (Bottom of the 1H channel).
T2: 55,200 - 55,050 (Strong 4H chart demand zone).
Key Levels for Observation:
Immediate Decision Point: 55,500 - 55,800.
Bullish Confirmation: A break above 55,800.
Warning Sign: A drop below 55,500.
Major Bullish Support: The 55,050 - 55,200 zone is crucial. A break below this would signal a significant shift in the trend.
Penafian
Maklumat dan penerbitan adalah tidak bertujuan, dan tidak membentuk, nasihat atau cadangan kewangan, pelaburan, dagangan atau jenis lain yang diberikan atau disahkan oleh TradingView. Baca lebih dalam Terma Penggunaan.
Penafian
Maklumat dan penerbitan adalah tidak bertujuan, dan tidak membentuk, nasihat atau cadangan kewangan, pelaburan, dagangan atau jenis lain yang diberikan atau disahkan oleh TradingView. Baca lebih dalam Terma Penggunaan.