4-Hour Chart:
Trend Context: Bank Nifty has shown a robust recovery within an ascending channel after a prior downtrend. Today's close (Sep 16th) was right at the upper boundary of this channel and nearing a significant resistance zone.
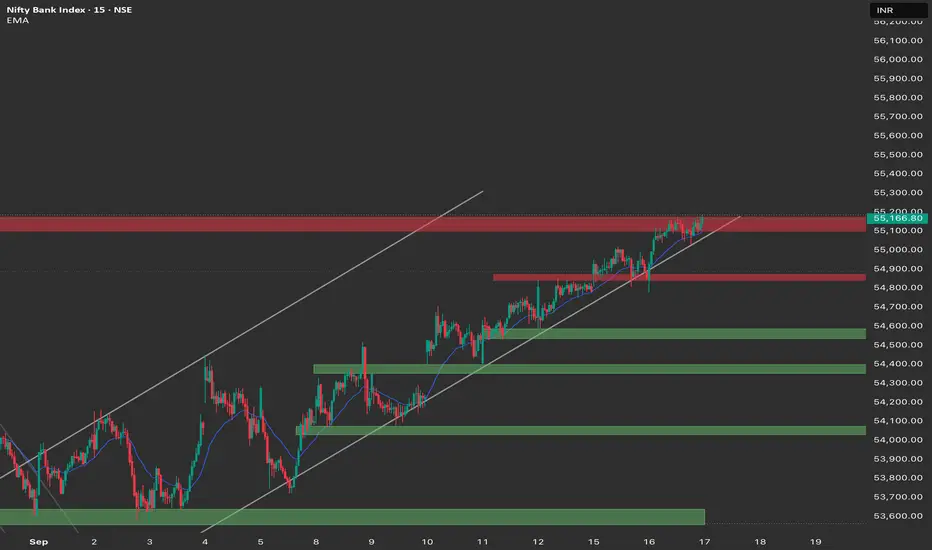
Key Resistance: The major red zone between 55,100 and 55,200 remains a critical overhead supply area. The close for Sep 16th at 55,166.80 places it just within this resistance band.
Key Support: The area around 54,600 - 54,700 is a significant support zone. The ascending channel's lower trendline is also below the current price, providing a broader support structure.
Observation: Bank Nifty has consistently made higher highs and higher lows within its ascending channel, approaching a strong resistance level. The closing candle suggests that price is actively challenging this resistance. A successful break above 55,100-55,200 would be a significant bullish development.
1-Hour Chart:
Intraday Structure: The 1-hour chart confirms the persistent bullish momentum, with price making higher highs and higher lows within the ascending channel. The surge towards the end of Sep 16th has brought the price right to the edge of the 55,100 - 55,200 resistance.
EMA (21): The EMA (21) is around 54,908, serving as an intraday support. The price closed significantly above it, reinforcing the bullish sentiment for the immediate term.
Fair Value Gap (FVG): The FVG between 54,700 - 54,800 was filled earlier in the day. This suggests that some prior imbalances have been resolved, and the market is now focused on the current resistance.
Breakout Potential: The price action on the 1-hour chart is indicative of a potential breakout. A sustained close above 55,100 on the 1-hour timeframe would be a strong signal for further upside.
Summary of Key Dynamics for September 17th:
Bank Nifty is poised at a crucial resistance level (55,100 - 55,200) after a strong upward move within an ascending channel. The closing price suggests that the market is actively testing this resistance. For September 17th, the key focus will be on whether Bank Nifty can break through this supply zone or if it will face rejection and pull back within the channel.
Trade Plan - Bank Nifty (17th September 2025)
Bullish Scenario:
Entry Triggers:
A decisive and sustained breakout and close above 55,100 on the 1-hour chart, confirmed by strong buying volume.
A strong bullish reaction from the upper trendline of the ascending channel if price pulls back slightly before attempting another breakout.
Target Levels:
55,200 (immediate psychological level post-breakout)
55,300 - 55,400 (next potential resistance zone)
Higher targets are possible if the breakout is strong, but will be determined by market sentiment and price action beyond 55,400.
Stop Loss:
For breakout entries: Below 55,000 or the low of the breakout candle.
For entries on channel support (if any): Below the upper trendline of the ascending channel or a previous minor swing low.
Bearish Scenario:
Entry Triggers:
A strong bearish rejection from the 55,100 - 55,200 resistance zone, indicated by bearish candlestick patterns (e.g., shooting star, bearish engulfing) on the 1-hour chart.
A decisive break and sustained trade below 55,000, signalling a failure to break resistance and a potential move back into the ascending channel.
A break below the 54,908 (EMA 20) could signal intraday weakness.
Target Levels:
55,000 (immediate psychological level on rejection)
54,908 (EMA 20)
54,700 - 54,600 (key support zone)
54,400 (next significant support level)
Stop Loss:
For rejection entries: Above the high of the rejection candle at resistance (likely above 55,250).
For breakdown entries: Above 55,100 or the immediate swing high.
🎯 Bias for 17th September 2025
Neutral to Bullish, with strong emphasis on breakout confirmation. Bank Nifty is at a critical resistance level (55,100 - 55,200). The bullish momentum from the ascending channel suggests a potential breakout.
Trend Context: Bank Nifty has shown a robust recovery within an ascending channel after a prior downtrend. Today's close (Sep 16th) was right at the upper boundary of this channel and nearing a significant resistance zone.
Key Resistance: The major red zone between 55,100 and 55,200 remains a critical overhead supply area. The close for Sep 16th at 55,166.80 places it just within this resistance band.
Key Support: The area around 54,600 - 54,700 is a significant support zone. The ascending channel's lower trendline is also below the current price, providing a broader support structure.
Observation: Bank Nifty has consistently made higher highs and higher lows within its ascending channel, approaching a strong resistance level. The closing candle suggests that price is actively challenging this resistance. A successful break above 55,100-55,200 would be a significant bullish development.
1-Hour Chart:
Intraday Structure: The 1-hour chart confirms the persistent bullish momentum, with price making higher highs and higher lows within the ascending channel. The surge towards the end of Sep 16th has brought the price right to the edge of the 55,100 - 55,200 resistance.
EMA (21): The EMA (21) is around 54,908, serving as an intraday support. The price closed significantly above it, reinforcing the bullish sentiment for the immediate term.
Fair Value Gap (FVG): The FVG between 54,700 - 54,800 was filled earlier in the day. This suggests that some prior imbalances have been resolved, and the market is now focused on the current resistance.
Breakout Potential: The price action on the 1-hour chart is indicative of a potential breakout. A sustained close above 55,100 on the 1-hour timeframe would be a strong signal for further upside.
Summary of Key Dynamics for September 17th:
Bank Nifty is poised at a crucial resistance level (55,100 - 55,200) after a strong upward move within an ascending channel. The closing price suggests that the market is actively testing this resistance. For September 17th, the key focus will be on whether Bank Nifty can break through this supply zone or if it will face rejection and pull back within the channel.
Trade Plan - Bank Nifty (17th September 2025)
Bullish Scenario:
Entry Triggers:
A decisive and sustained breakout and close above 55,100 on the 1-hour chart, confirmed by strong buying volume.
A strong bullish reaction from the upper trendline of the ascending channel if price pulls back slightly before attempting another breakout.
Target Levels:
55,200 (immediate psychological level post-breakout)
55,300 - 55,400 (next potential resistance zone)
Higher targets are possible if the breakout is strong, but will be determined by market sentiment and price action beyond 55,400.
Stop Loss:
For breakout entries: Below 55,000 or the low of the breakout candle.
For entries on channel support (if any): Below the upper trendline of the ascending channel or a previous minor swing low.
Bearish Scenario:
Entry Triggers:
A strong bearish rejection from the 55,100 - 55,200 resistance zone, indicated by bearish candlestick patterns (e.g., shooting star, bearish engulfing) on the 1-hour chart.
A decisive break and sustained trade below 55,000, signalling a failure to break resistance and a potential move back into the ascending channel.
A break below the 54,908 (EMA 20) could signal intraday weakness.
Target Levels:
55,000 (immediate psychological level on rejection)
54,908 (EMA 20)
54,700 - 54,600 (key support zone)
54,400 (next significant support level)
Stop Loss:
For rejection entries: Above the high of the rejection candle at resistance (likely above 55,250).
For breakdown entries: Above 55,100 or the immediate swing high.
🎯 Bias for 17th September 2025
Neutral to Bullish, with strong emphasis on breakout confirmation. Bank Nifty is at a critical resistance level (55,100 - 55,200). The bullish momentum from the ascending channel suggests a potential breakout.
Penafian
Maklumat dan penerbitan adalah tidak bertujuan, dan tidak membentuk, nasihat atau cadangan kewangan, pelaburan, dagangan atau jenis lain yang diberikan atau disahkan oleh TradingView. Baca lebih dalam Terma Penggunaan.
Penafian
Maklumat dan penerbitan adalah tidak bertujuan, dan tidak membentuk, nasihat atau cadangan kewangan, pelaburan, dagangan atau jenis lain yang diberikan atau disahkan oleh TradingView. Baca lebih dalam Terma Penggunaan.