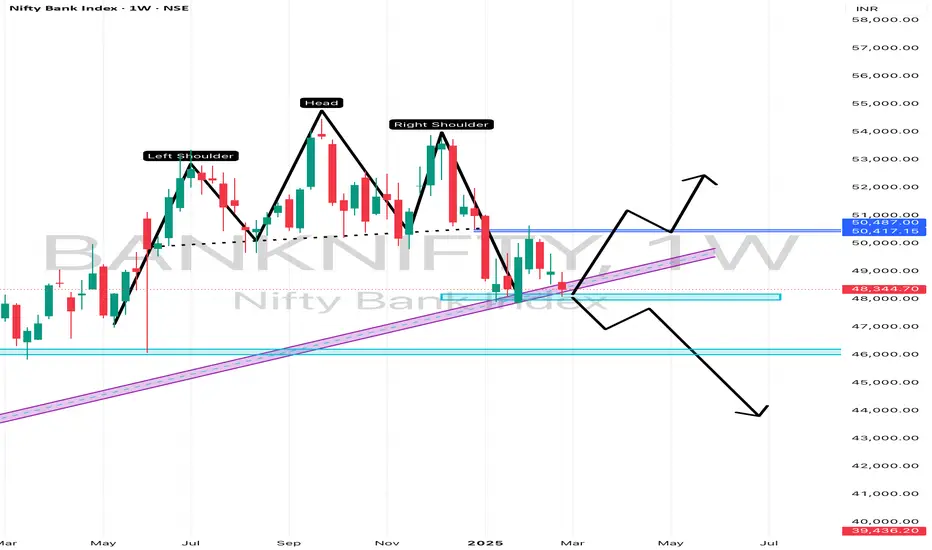
This is a technical analysis of the Nifty Bank Index (Bank Nifty) on a Weekly (1W) timeframe. It displays a Head and Shoulders pattern, which is typically a bearish reversal pattern.
Key Observations:
1. Head and Shoulders Pattern:
• The chart clearly marks the Left Shoulder, Head, and Right Shoulder, indicating a potential trend reversal.
• The neckline (support level) has been broken or is being tested.
2. Key Support and Resistance Zones:
• Support Levels:
• Around 48,000 (current level)
• Stronger support near 46,000, marked in a blue zone.
• Resistance Zone:
• Near 50,487 - 50,417 (blue horizontal resistance).
3. Trendlines and Predictions:
• A purple trendline supports the price, but if broken, it may confirm further downside.
• Two possible scenarios are depicted:
• Bullish Reversal: Price bounces from the trendline, moves above 50,487, and continues upward.
• Bearish Breakdown: Price fails to hold, breaks below 48,000 and 46,000, leading to a deeper decline towards 44,000.
Interpretation:
• If Bank Nifty sustains above the purple trendline and blue resistance (50,487), a bullish recovery could occur.
• If it breaks below 48,000-46,000, further downside towards 44,000 or lower is possible.
• The chart suggests a critical decision point, with both bullish and bearish possibilities depending on price action.
Penafian
Maklumat dan penerbitan adalah tidak dimaksudkan untuk menjadi, dan tidak membentuk, nasihat untuk kewangan, pelaburan, perdagangan dan jenis-jenis lain atau cadangan yang dibekalkan atau disahkan oleh TradingView. Baca dengan lebih lanjut di Terma Penggunaan.
Penafian
Maklumat dan penerbitan adalah tidak dimaksudkan untuk menjadi, dan tidak membentuk, nasihat untuk kewangan, pelaburan, perdagangan dan jenis-jenis lain atau cadangan yang dibekalkan atau disahkan oleh TradingView. Baca dengan lebih lanjut di Terma Penggunaan.
