📊 Market Structure (BankNifty)
🔹 4H Chart
Clear downtrend channel intact (lower highs & lower lows).
Price recently bounced from 54,600 demand zone and is hovering around 55,200–55,400 supply zone.
Overhead resistances at 55,800 → 56,200 → 57,200 remain strong.
Trend remains bearish-to-sideways until a clean break above 56,000+.
🔹 1H Chart
Price is consolidating between 55,200 (support) and 55,600 (resistance).
Sellers are defending 55,600; repeated rejections show supply pressure.
Below 55,200, next demand is 54,800–54,600.
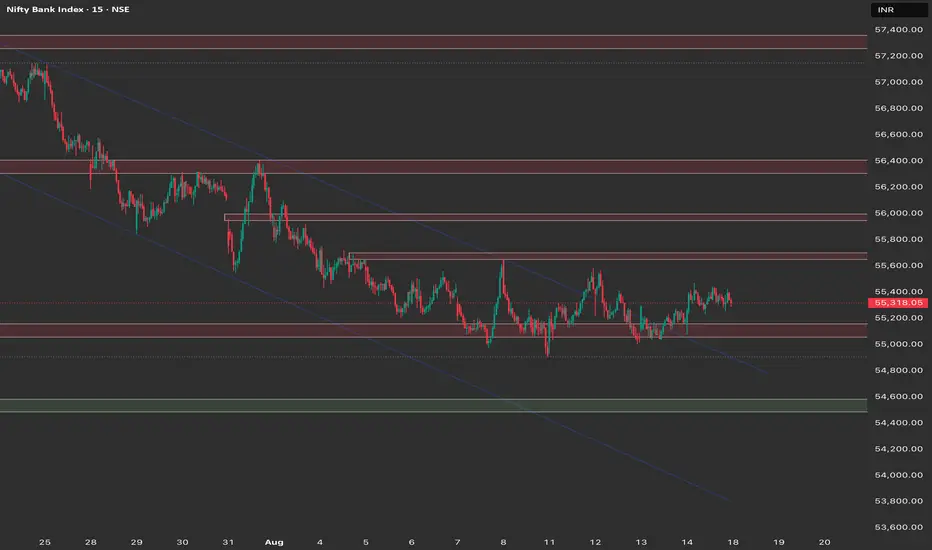
🔹 15M Chart
Short-term structure: range-bound chop between 55,200–55,600.
Intraday traders should watch for a breakout/breakdown from this box for directional momentum.
🎯 Trade Plan for 18th August (Monday)
📈 Bullish Plan
Entry: Above 55,600 breakout (sustained with volume).
Targets:
55,800
56,200
Stop Loss: 55,350 (below breakout candle low).
Note: Only aggressive buying above 55,600; until then upside capped.
📉 Bearish Plan
Entry 1: On rejection near 55,600 zone.
Target: 55,200 → 54,800 → 54,600
SL: 55,700
Entry 2: Breakdown below 55,200.
Target: 54,800 → 54,600
SL: 55,400
⚖️ Neutral / Sideways Bias
If price stays between 55,200–55,600, expect chop.
Best to avoid over-trading inside this zone — wait for clear direction.
📝 Summary
Bias: Sideways-to-bearish unless BankNifty closes above 55,600.
Key Levels:
Support: 55,200 → 54,800 → 54,600
Resistance: 55,600 → 55,800 → 56,200
Strategy: Sell on rise near resistances until 55,600 is taken out. Only above 55,600 can we play for 56,200+.
🔹 4H Chart
Clear downtrend channel intact (lower highs & lower lows).
Price recently bounced from 54,600 demand zone and is hovering around 55,200–55,400 supply zone.
Overhead resistances at 55,800 → 56,200 → 57,200 remain strong.
Trend remains bearish-to-sideways until a clean break above 56,000+.
🔹 1H Chart
Price is consolidating between 55,200 (support) and 55,600 (resistance).
Sellers are defending 55,600; repeated rejections show supply pressure.
Below 55,200, next demand is 54,800–54,600.
🔹 15M Chart
Short-term structure: range-bound chop between 55,200–55,600.
Intraday traders should watch for a breakout/breakdown from this box for directional momentum.
🎯 Trade Plan for 18th August (Monday)
📈 Bullish Plan
Entry: Above 55,600 breakout (sustained with volume).
Targets:
55,800
56,200
Stop Loss: 55,350 (below breakout candle low).
Note: Only aggressive buying above 55,600; until then upside capped.
📉 Bearish Plan
Entry 1: On rejection near 55,600 zone.
Target: 55,200 → 54,800 → 54,600
SL: 55,700
Entry 2: Breakdown below 55,200.
Target: 54,800 → 54,600
SL: 55,400
⚖️ Neutral / Sideways Bias
If price stays between 55,200–55,600, expect chop.
Best to avoid over-trading inside this zone — wait for clear direction.
📝 Summary
Bias: Sideways-to-bearish unless BankNifty closes above 55,600.
Key Levels:
Support: 55,200 → 54,800 → 54,600
Resistance: 55,600 → 55,800 → 56,200
Strategy: Sell on rise near resistances until 55,600 is taken out. Only above 55,600 can we play for 56,200+.
Penafian
Maklumat dan penerbitan adalah tidak bertujuan, dan tidak membentuk, nasihat atau cadangan kewangan, pelaburan, dagangan atau jenis lain yang diberikan atau disahkan oleh TradingView. Baca lebih dalam Terma Penggunaan.
Penafian
Maklumat dan penerbitan adalah tidak bertujuan, dan tidak membentuk, nasihat atau cadangan kewangan, pelaburan, dagangan atau jenis lain yang diberikan atau disahkan oleh TradingView. Baca lebih dalam Terma Penggunaan.