BANK NIFTY TRADING PLAN – 04-Sep-2025
📌 Key Levels to Watch:
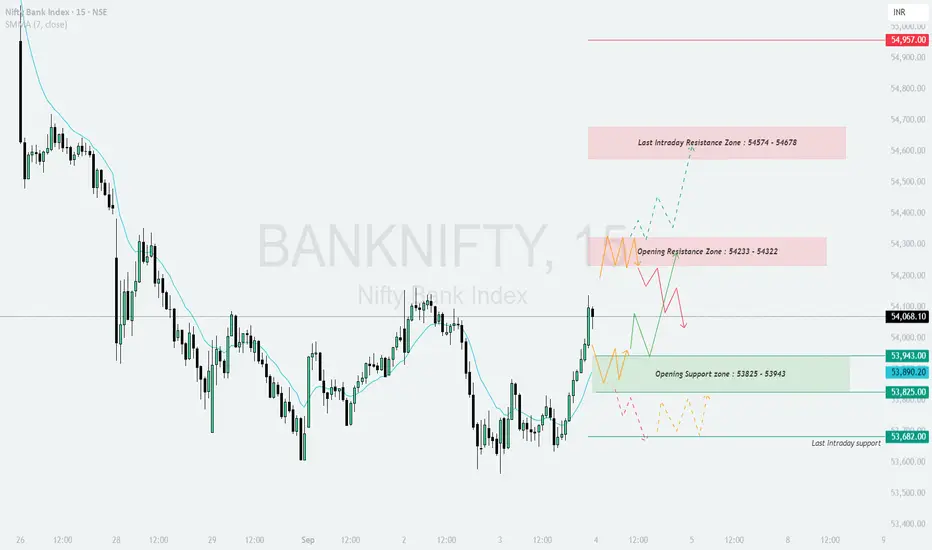
Opening Resistance Zone: 54,233 – 54,322
Last Intraday Resistance Zone: 54,574 – 54,678
Major Resistance: 54,957
Opening Support Zone: 53,825 – 53,943
Last Intraday Support: 53,682
These levels will define intraday trend strength and reversals. Let’s analyze scenarios:
🔼 1. Gap-Up Opening (200+ points above 54,233)
If Bank Nifty opens significantly higher above 54,233, it will enter the resistance zone and buyers will aim to test 54,574 – 54,678.
📌 Plan of Action:
👉 Educational Note: Gap-ups near resistance zones can often trap late buyers. Always wait for confirmation before entering fresh longs.
➖ 2. Flat Opening (Around 53,900 – 54,100)
A flat start near current levels indicates balance. Intraday movement will depend on whether support or resistance breaks first.
📌 Plan of Action:
👉 Educational Note: Flat openings often provide the cleanest intraday trends once the first 30 minutes establish direction.
🔽 3. Gap-Down Opening (200+ points below 53,825)
If Bank Nifty opens weak below 53,825, sellers will take control, with supports coming into play.
📌 Plan of Action:
👉 Educational Note: Gap-downs can trigger panic selling, but experienced traders should watch for reversal patterns near strong supports.
🛡️ Risk Management Tips for Options Traders
📌 Summary & Conclusion
🟢 Above 54,233 → Upside towards 54,574 – 54,678, extended 54,957.
🟧 Flat Opening → Range-bound between 53,825 – 54,322; breakout will decide direction.
🔴 Below 53,825 → Weakness towards 53,682 and possibly lower.
⚠️ Key Pivot Zone: 53,825 – 53,943 will act as the critical battleground for bulls and bears.
⚠️ Disclaimer: I am not a SEBI-registered analyst. This trading plan is for educational purposes only and should not be treated as financial advice. Please consult your financial advisor before making trading decisions.
📌 Key Levels to Watch:
Opening Resistance Zone: 54,233 – 54,322
Last Intraday Resistance Zone: 54,574 – 54,678
Major Resistance: 54,957
Opening Support Zone: 53,825 – 53,943
Last Intraday Support: 53,682
These levels will define intraday trend strength and reversals. Let’s analyze scenarios:
🔼 1. Gap-Up Opening (200+ points above 54,233)
If Bank Nifty opens significantly higher above 54,233, it will enter the resistance zone and buyers will aim to test 54,574 – 54,678.
📌 Plan of Action:
- [] Sustaining above 54,322 can lead to a quick rally towards 54,574 – 54,678.
[] Booking profits near this zone is advised, as sellers may step in. - If momentum extends, the next target will be 54,957, but only if 54,678 breaks with strength.
👉 Educational Note: Gap-ups near resistance zones can often trap late buyers. Always wait for confirmation before entering fresh longs.
➖ 2. Flat Opening (Around 53,900 – 54,100)
A flat start near current levels indicates balance. Intraday movement will depend on whether support or resistance breaks first.
📌 Plan of Action:
- [] Holding above 53,943 (Opening Support) can push price towards 54,233 – 54,322 (Resistance Zone).
[] A breakout above this zone may open the path to 54,574 – 54,678. - If price slips below 53,825, weakness can extend towards 53,682.
👉 Educational Note: Flat openings often provide the cleanest intraday trends once the first 30 minutes establish direction.
🔽 3. Gap-Down Opening (200+ points below 53,825)
If Bank Nifty opens weak below 53,825, sellers will take control, with supports coming into play.
📌 Plan of Action:
- [] A gap-down below 53,825 increases probability of a slide towards 53,682 (Last Intraday Support).
[] If 53,682 breaks, the downside can intensify with sharp selling. - Any bounce from this zone should be treated cautiously unless price regains 53,825 – 53,943.
👉 Educational Note: Gap-downs can trigger panic selling, but experienced traders should watch for reversal patterns near strong supports.
🛡️ Risk Management Tips for Options Traders
- [] Always place stop losses based on hourly close.
[] Limit risk to 1–2% of trading capital per position.
[] Scale out profits – exit part at first target, hold balance for extended moves.
[] Avoid over-leveraging in weekly expiry days to reduce volatility risk. - When uncertainty is high, prefer spreads (Bull Call / Bear Put) over naked options.
📌 Summary & Conclusion
🟢 Above 54,233 → Upside towards 54,574 – 54,678, extended 54,957.
🟧 Flat Opening → Range-bound between 53,825 – 54,322; breakout will decide direction.
🔴 Below 53,825 → Weakness towards 53,682 and possibly lower.
⚠️ Key Pivot Zone: 53,825 – 53,943 will act as the critical battleground for bulls and bears.
⚠️ Disclaimer: I am not a SEBI-registered analyst. This trading plan is for educational purposes only and should not be treated as financial advice. Please consult your financial advisor before making trading decisions.
Penafian
Maklumat dan penerbitan adalah tidak dimaksudkan untuk menjadi, dan tidak membentuk, nasihat untuk kewangan, pelaburan, perdagangan dan jenis-jenis lain atau cadangan yang dibekalkan atau disahkan oleh TradingView. Baca dengan lebih lanjut di Terma Penggunaan.
Penafian
Maklumat dan penerbitan adalah tidak dimaksudkan untuk menjadi, dan tidak membentuk, nasihat untuk kewangan, pelaburan, perdagangan dan jenis-jenis lain atau cadangan yang dibekalkan atau disahkan oleh TradingView. Baca dengan lebih lanjut di Terma Penggunaan.