4-Hour Chart (Swing Context)
Trend: Ascending channel formation after a prior downtrend.
Key Zone: Approaching the 54,900-55,100 supply zone.
Previous Break: Impulsive leg broke above 54,600, now acting as potential demand. Bias: Bullish momentum, but within a significant resistance zone.
1-Hour Chart (Intraday Context)
Structure: Clear higher highs & higher lows (bullish structure).
Support: 54,600 level (former resistance turned demand) showing strong bounces.
Current Action: Consolidating below the 54,900-55,100 supply.
BOS: Confirms buyer dominance, but upside liquidity appears to be thinning.
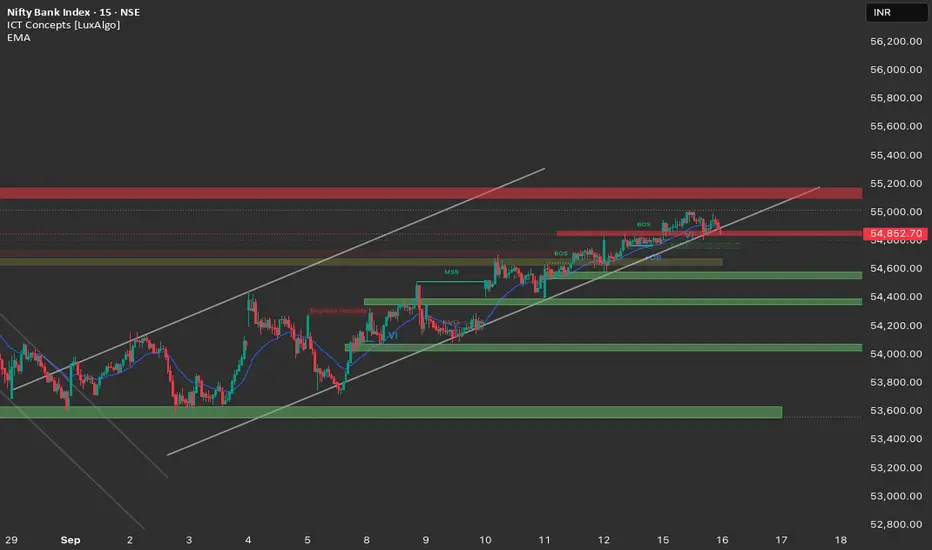
15-Minute Chart (Execution View)
Action: Sideways consolidation below 54,950.
OB: Order block around 54,550-54,600 acts as support buffer.
FVG: Minor FVGs in 54,700-54,750 zone may offer intraday support.
Channel: Price respecting the ascending channel boundaries.
Trade Plan (16th September)
Bullish Scenario
Entry: Buy on retracement near 54,550-54,600 demand zone (OB + structure support).
Targets:
TP1: 54,850 (intraday liquidity)
TP2: 54,900-55,000 (supply zone top & channel resistance)
Stop Loss: Below 54,450 (channel bottom & invalidation).
Bearish Scenario
Entry: Short on rejection of 54,900-55,100 zone with strong bearish signal (e.g., engulfing).
Targets:
TP1: 54,700 (potential FVG fill)
TP2: 54,550-54,600 (major demand zone/OB)
Stop Loss: Above 55,100.
Bias: Neutral-to-Bullish. Expecting a potential pullback to 54,550-54,600 before a move towards the 54,900-55,100 resistance.
Caution: If 54,550-54,600 fails, expect downside acceleration towards 54,300-54,100.
Trend: Ascending channel formation after a prior downtrend.
Key Zone: Approaching the 54,900-55,100 supply zone.
Previous Break: Impulsive leg broke above 54,600, now acting as potential demand. Bias: Bullish momentum, but within a significant resistance zone.
1-Hour Chart (Intraday Context)
Structure: Clear higher highs & higher lows (bullish structure).
Support: 54,600 level (former resistance turned demand) showing strong bounces.
Current Action: Consolidating below the 54,900-55,100 supply.
BOS: Confirms buyer dominance, but upside liquidity appears to be thinning.
15-Minute Chart (Execution View)
Action: Sideways consolidation below 54,950.
OB: Order block around 54,550-54,600 acts as support buffer.
FVG: Minor FVGs in 54,700-54,750 zone may offer intraday support.
Channel: Price respecting the ascending channel boundaries.
Trade Plan (16th September)
Bullish Scenario
Entry: Buy on retracement near 54,550-54,600 demand zone (OB + structure support).
Targets:
TP1: 54,850 (intraday liquidity)
TP2: 54,900-55,000 (supply zone top & channel resistance)
Stop Loss: Below 54,450 (channel bottom & invalidation).
Bearish Scenario
Entry: Short on rejection of 54,900-55,100 zone with strong bearish signal (e.g., engulfing).
Targets:
TP1: 54,700 (potential FVG fill)
TP2: 54,550-54,600 (major demand zone/OB)
Stop Loss: Above 55,100.
Bias: Neutral-to-Bullish. Expecting a potential pullback to 54,550-54,600 before a move towards the 54,900-55,100 resistance.
Caution: If 54,550-54,600 fails, expect downside acceleration towards 54,300-54,100.
Penafian
Maklumat dan penerbitan adalah tidak dimaksudkan untuk menjadi, dan tidak membentuk, nasihat untuk kewangan, pelaburan, perdagangan dan jenis-jenis lain atau cadangan yang dibekalkan atau disahkan oleh TradingView. Baca dengan lebih lanjut di Terma Penggunaan.
Penafian
Maklumat dan penerbitan adalah tidak dimaksudkan untuk menjadi, dan tidak membentuk, nasihat untuk kewangan, pelaburan, perdagangan dan jenis-jenis lain atau cadangan yang dibekalkan atau disahkan oleh TradingView. Baca dengan lebih lanjut di Terma Penggunaan.