📊 BANK NIFTY TRADING PLAN — 17 NOV 2025
(Timeframe Reference: 15-Min Chart)
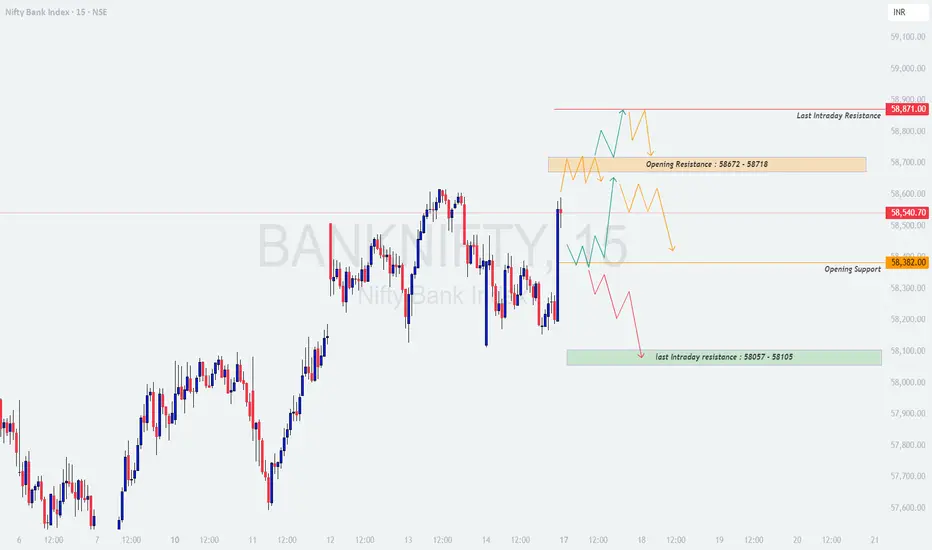
Chart Summary:
Bank Nifty closed around 58,540, maintaining a balanced yet volatile structure. The index is currently trading near its Opening Resistance Zone (58,672 – 58,718), while immediate support lies near 58,382. Below this, the next key zone is Last Intraday Resistance turned Support (58,057 – 58,105).
The price structure suggests a neutral-to-slightly bullish tone as long as the index sustains above 58,382. A breakout above 58,718 may open the path toward 58,871, while a breakdown below 58,382 can trigger a slide toward 58,100.
Key Zones to Watch:
🟩 Supports: 58,382 / 58,100
🟥 Resistances: 58,718 / 58,871
⚖️ Bias Zone: 58,382 – 58,672 (Consolidation / No Trade Zone until clear breakout)
---
🟢 Scenario 1: GAP-UP Opening (200+ Points)
If Bank Nifty opens around or above 58,740 – 58,800, it will directly enter or open above the Opening Resistance Zone (58,672 – 58,718). Such a start could attract aggressive buying, but traders must be cautious of early profit booking near the Last Intraday Resistance (58,871).
💡 Educational Note:
Gap-ups near resistance often attract emotional buying from retail traders. Smart traders wait for confirmation of strength. Sustained price action above resistance with high volume signals institutional participation, while failure to hold levels hints at profit booking.
---
🟧 Scenario 2: FLAT Opening (Around 58,400 – 58,500 Zone)
A flat opening near the Opening Support (58,382) would keep Bank Nifty within a narrow consolidation range. This zone often becomes a “no trade” area until a clear breakout or breakdown confirms direction.
🧠 Educational Tip:
Flat openings test a trader’s patience. Most false trades occur when traders act before confirmation. Wait for volume-backed direction to emerge. Consolidation breakouts tend to be powerful once the direction is clear — discipline pays better than early entry.
---
🔴 Scenario 3: GAP-DOWN Opening (200+ Points)
If Bank Nifty opens around 58,200 – 58,250, it will open below the Opening Support (58,382). Such a move will test buyer strength and may invite early selling pressure.
📘 Educational Insight:
Gap-down openings often trigger emotional selling. Experienced traders analyze whether the move is driven by real weakness or short-term panic. Watch candle structures and volume shifts at support zones — they reveal market intent better than speculation.
---
💼 RISK MANAGEMENT TIPS FOR OPTIONS TRADERS:
---
📈 SUMMARY:
---
📚 CONCLUSION:
Bank Nifty is poised for a breakout move after recent consolidation. The price action around 58,382 – 58,672 will define the day’s direction. A sustained breakout above 58,718 can lead to strong upside momentum toward 58,871 – 59,000, while a breakdown below 58,382 can pull prices toward 58,100.
Patience, confirmation, and discipline remain the core edge for intraday traders. Avoid early trades during uncertain openings — wait for direction to align with volume and momentum.
📊 Remember: Trading is a game of probability, not certainty. Consistency in execution and risk control builds long-term success.
---
⚠️ DISCLAIMER:
I am not a SEBI-registered analyst. The analysis above is shared purely for educational and informational purposes. Please conduct your own research or consult a certified financial advisor before making any trading or investment decisions.
(Timeframe Reference: 15-Min Chart)
Chart Summary:
Bank Nifty closed around 58,540, maintaining a balanced yet volatile structure. The index is currently trading near its Opening Resistance Zone (58,672 – 58,718), while immediate support lies near 58,382. Below this, the next key zone is Last Intraday Resistance turned Support (58,057 – 58,105).
The price structure suggests a neutral-to-slightly bullish tone as long as the index sustains above 58,382. A breakout above 58,718 may open the path toward 58,871, while a breakdown below 58,382 can trigger a slide toward 58,100.
Key Zones to Watch:
🟩 Supports: 58,382 / 58,100
🟥 Resistances: 58,718 / 58,871
⚖️ Bias Zone: 58,382 – 58,672 (Consolidation / No Trade Zone until clear breakout)
---
🟢 Scenario 1: GAP-UP Opening (200+ Points)
If Bank Nifty opens around or above 58,740 – 58,800, it will directly enter or open above the Opening Resistance Zone (58,672 – 58,718). Such a start could attract aggressive buying, but traders must be cautious of early profit booking near the Last Intraday Resistance (58,871).
- If price sustains above 58,718 for 15–20 minutes with strong bullish candles and volume, expect continuation toward 58,871.
- If momentum sustains beyond 58,871, the next possible target zone is 58,950 – 59,000.
- If the index fails to sustain above 58,718 and forms rejection candles, a pullback toward 58,540 – 58,382 could occur.
- Avoid chasing the gap-up; instead, wait for a retest of 58,718 — a breakout confirmation followed by retest offers the best low-risk entry.
💡 Educational Note:
Gap-ups near resistance often attract emotional buying from retail traders. Smart traders wait for confirmation of strength. Sustained price action above resistance with high volume signals institutional participation, while failure to hold levels hints at profit booking.
---
🟧 Scenario 2: FLAT Opening (Around 58,400 – 58,500 Zone)
A flat opening near the Opening Support (58,382) would keep Bank Nifty within a narrow consolidation range. This zone often becomes a “no trade” area until a clear breakout or breakdown confirms direction.
- Avoid trading within 58,382 – 58,672 early in the session — this is a neutral consolidation zone.
- If price breaks above 58,672 with strength, expect bullish momentum toward 58,871.
- If price breaks below 58,382, weakness could extend toward 58,100.
- Watch for volume confirmation — breakout without volume can lead to false signals.
🧠 Educational Tip:
Flat openings test a trader’s patience. Most false trades occur when traders act before confirmation. Wait for volume-backed direction to emerge. Consolidation breakouts tend to be powerful once the direction is clear — discipline pays better than early entry.
---
🔴 Scenario 3: GAP-DOWN Opening (200+ Points)
If Bank Nifty opens around 58,200 – 58,250, it will open below the Opening Support (58,382). Such a move will test buyer strength and may invite early selling pressure.
- If the index holds near 58,200 – 58,100 and forms bullish reversal candles (like hammer, morning star, or bullish engulfing), a recovery toward 58,382 – 58,540 could follow.
- If price fails to hold above 58,100, expect further downside toward 57,950 – 57,880.
- Avoid panic shorting after a big gap-down — instead, wait for a pullback toward 58,300 – 58,350 to initiate trades with defined risk.
- Falling volume on red candles indicates selling exhaustion — this can be the first hint of reversal setups.
📘 Educational Insight:
Gap-down openings often trigger emotional selling. Experienced traders analyze whether the move is driven by real weakness or short-term panic. Watch candle structures and volume shifts at support zones — they reveal market intent better than speculation.
---
💼 RISK MANAGEMENT TIPS FOR OPTIONS TRADERS:
- Avoid taking trades during the first 15–20 minutes of the session — IV (Implied Volatility) spikes can distort option premiums.
- Never risk more than 1–2% of your total trading capital in a single trade.
- Prefer ATM or slightly ITM options for directional trades — avoid deep OTM unless it’s a confirmed momentum breakout.
- Trail your stop-loss once your trade moves 30–40 points in your favor — this protects profits.
- Book partial profits at key zones like support/resistance levels and let the rest ride with a trailing SL.
- Avoid averaging losing positions — focus on capital preservation first.
---
📈 SUMMARY:
- 🟧 Neutral Zone: 58,382 – 58,672
- 🟥 Resistance Zones: 58,718 / 58,871
- 🟩 Support Zones: 58,382 / 58,100
- ⚖️ Bias: Bullish above 58,672 | Bearish below 58,382
---
📚 CONCLUSION:
Bank Nifty is poised for a breakout move after recent consolidation. The price action around 58,382 – 58,672 will define the day’s direction. A sustained breakout above 58,718 can lead to strong upside momentum toward 58,871 – 59,000, while a breakdown below 58,382 can pull prices toward 58,100.
Patience, confirmation, and discipline remain the core edge for intraday traders. Avoid early trades during uncertain openings — wait for direction to align with volume and momentum.
📊 Remember: Trading is a game of probability, not certainty. Consistency in execution and risk control builds long-term success.
---
⚠️ DISCLAIMER:
I am not a SEBI-registered analyst. The analysis above is shared purely for educational and informational purposes. Please conduct your own research or consult a certified financial advisor before making any trading or investment decisions.
Penafian
The information and publications are not meant to be, and do not constitute, financial, investment, trading, or other types of advice or recommendations supplied or endorsed by TradingView. Read more in the Terms of Use.
Penafian
The information and publications are not meant to be, and do not constitute, financial, investment, trading, or other types of advice or recommendations supplied or endorsed by TradingView. Read more in the Terms of Use.