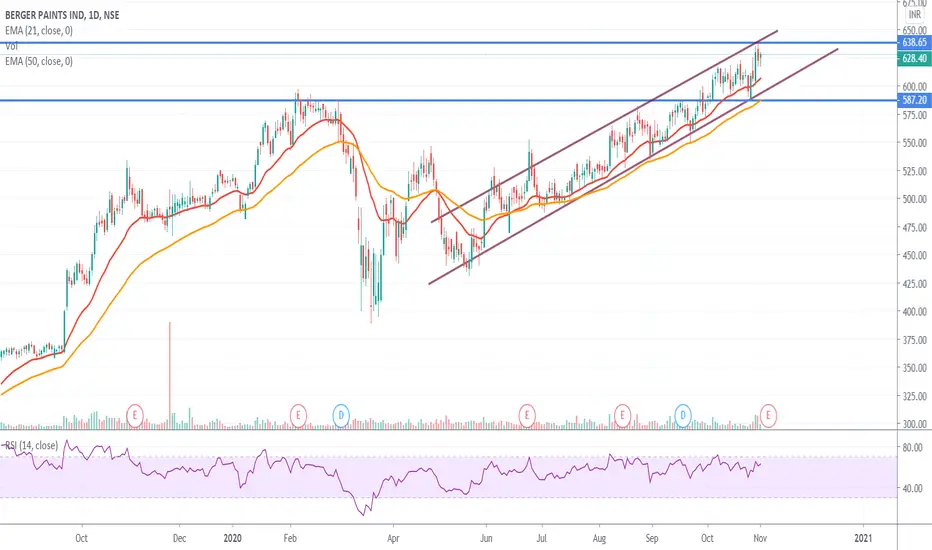
Price - 628.40 Dt. - 03-11-2020
On a daily chart, the stock is moving in a range. Price bounce back after touching the 21DEMA line and occasionally the price breaks the 21DEMA line and goes till 50DEMA. It looks like the price can come up to 21DEMA or if there will be selling pressure than the price takes the support of the 50DEMA or the below trendline. RSI is near the overbought zone.
On a daily chart, the stock is moving in a range. Price bounce back after touching the 21DEMA line and occasionally the price breaks the 21DEMA line and goes till 50DEMA. It looks like the price can come up to 21DEMA or if there will be selling pressure than the price takes the support of the 50DEMA or the below trendline. RSI is near the overbought zone.
Penafian
Maklumat dan penerbitan adalah tidak dimaksudkan untuk menjadi, dan tidak membentuk, nasihat untuk kewangan, pelaburan, perdagangan dan jenis-jenis lain atau cadangan yang dibekalkan atau disahkan oleh TradingView. Baca dengan lebih lanjut di Terma Penggunaan.
Penafian
Maklumat dan penerbitan adalah tidak dimaksudkan untuk menjadi, dan tidak membentuk, nasihat untuk kewangan, pelaburan, perdagangan dan jenis-jenis lain atau cadangan yang dibekalkan atau disahkan oleh TradingView. Baca dengan lebih lanjut di Terma Penggunaan.