📊 BIRLA CABLE LTD (BIRLACABLE) – Cup & Handle Breakout with Fibonacci Targets | RSI Overbought | Volume Spike | Daily Chart
📅 Chart Date: June 18, 2025
📈 CMP: ₹208.05 (+14.11%)
📍 Ticker: NSE:BIRLACABLE
🔍 Technical Chart Breakdown
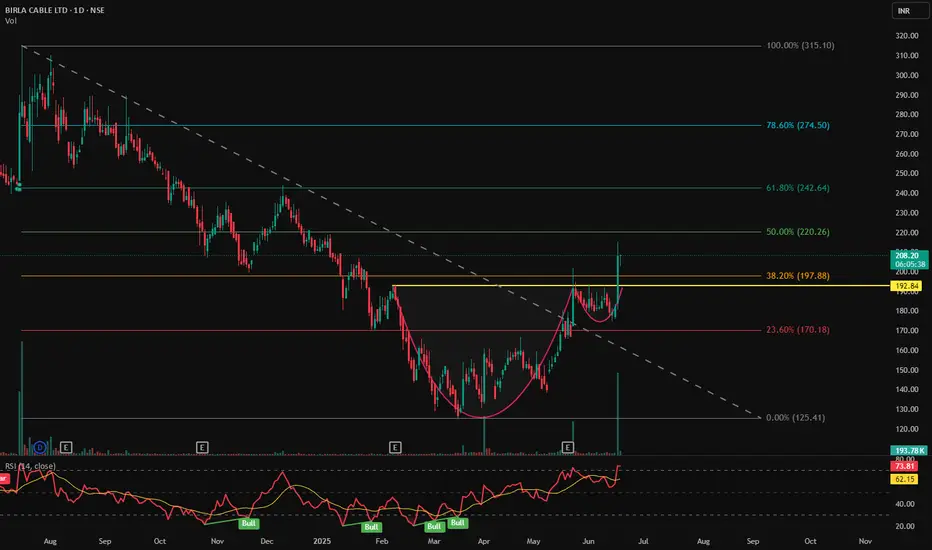
☕ Cup & Handle Pattern Breakout
BIRLACABLE has confirmed a Cup & Handle breakout above the neckline at ₹197.88 (also 38.2% Fibonacci retracement level), suggesting bullish continuation after a long consolidation. The breakout is clean with a wide bullish candle.
📐 Fibonacci Retracement Levels (from swing high ₹315.10 to swing low ₹125.41)
38.2% (Breakout Zone): ₹197.88 ✅
50.0%: ₹220.26
61.8%: ₹242.64
78.6%: ₹274.50
Target: 100% Fibonacci: ₹315+
💹 RSI & Momentum
RSI at 73.75, entering overbought territory 🔼
Multiple RSI bullish crossovers visible during base formation
RSI suggests strong buying momentum, ideal for trend continuation
📉 Trendline Breakout
Downtrend resistance (dotted line) broken along with horizontal neckline
Aligns with volume-based breakout, confirming strength
🕯️ Volume Confirmation
Huge spike in volume (4.44M) on breakout day — highest in months
Suggests institutional or smart money activity
📍 Key Price Levels
✅ Breakout Level: ₹197.88
🚀 Fibonacci Targets:
₹220.26 → 50%
₹242.64 → 61.8%
₹274.50 → 78.6%
₹315+ → 100% (Full target)
🛡️ Support Levels:
₹197 (neckline support)
₹170.18 (23.6% Fib)
₹150 (handle base)
💡 Trading Idea
Entry: Close above ₹198 or on retest of neckline
Stop Loss: Below ₹185 or ₹170
Targets: ₹220 → ₹243 → ₹275 → ₹315
Risk-Reward: Favorable with strong confirmation
📅 Chart Date: June 18, 2025
📈 CMP: ₹208.05 (+14.11%)
📍 Ticker: NSE:BIRLACABLE
🔍 Technical Chart Breakdown
☕ Cup & Handle Pattern Breakout
BIRLACABLE has confirmed a Cup & Handle breakout above the neckline at ₹197.88 (also 38.2% Fibonacci retracement level), suggesting bullish continuation after a long consolidation. The breakout is clean with a wide bullish candle.
📐 Fibonacci Retracement Levels (from swing high ₹315.10 to swing low ₹125.41)
38.2% (Breakout Zone): ₹197.88 ✅
50.0%: ₹220.26
61.8%: ₹242.64
78.6%: ₹274.50
Target: 100% Fibonacci: ₹315+
💹 RSI & Momentum
RSI at 73.75, entering overbought territory 🔼
Multiple RSI bullish crossovers visible during base formation
RSI suggests strong buying momentum, ideal for trend continuation
📉 Trendline Breakout
Downtrend resistance (dotted line) broken along with horizontal neckline
Aligns with volume-based breakout, confirming strength
🕯️ Volume Confirmation
Huge spike in volume (4.44M) on breakout day — highest in months
Suggests institutional or smart money activity
📍 Key Price Levels
✅ Breakout Level: ₹197.88
🚀 Fibonacci Targets:
₹220.26 → 50%
₹242.64 → 61.8%
₹274.50 → 78.6%
₹315+ → 100% (Full target)
🛡️ Support Levels:
₹197 (neckline support)
₹170.18 (23.6% Fib)
₹150 (handle base)
💡 Trading Idea
Entry: Close above ₹198 or on retest of neckline
Stop Loss: Below ₹185 or ₹170
Targets: ₹220 → ₹243 → ₹275 → ₹315
Risk-Reward: Favorable with strong confirmation
Dagangan ditutup: hentian tercapai
Penafian
Maklumat dan penerbitan adalah tidak bertujuan, dan tidak membentuk, nasihat atau cadangan kewangan, pelaburan, dagangan atau jenis lain yang diberikan atau disahkan oleh TradingView. Baca lebih dalam Terma Penggunaan.
Penafian
Maklumat dan penerbitan adalah tidak bertujuan, dan tidak membentuk, nasihat atau cadangan kewangan, pelaburan, dagangan atau jenis lain yang diberikan atau disahkan oleh TradingView. Baca lebih dalam Terma Penggunaan.