________________________________________
📊 BLUE STAR LTD – Beginner-Friendly Technical & Fundamental Snapshot
Ticker: NSE:BLUESTARCO | Sector: Consumer Durables
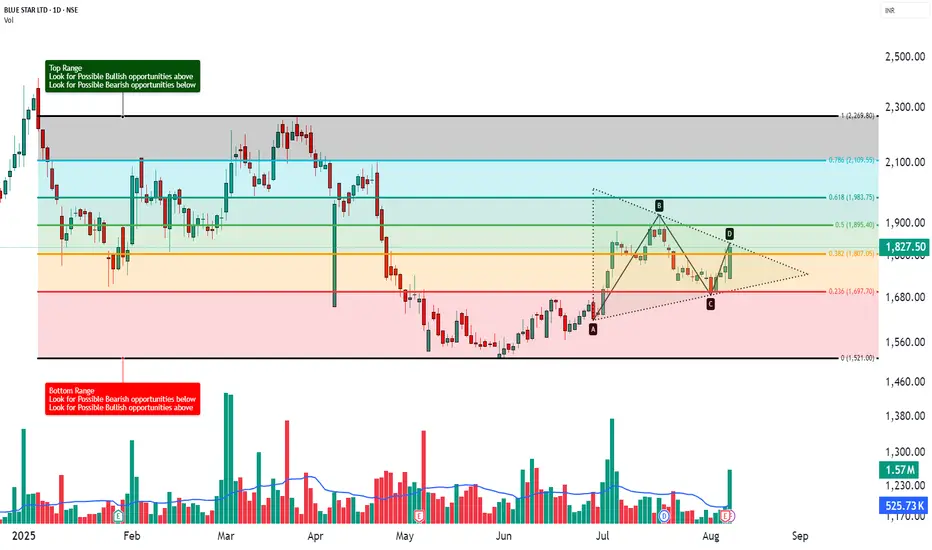
CMP: ₹1,827.50 ▲ (+3.23%) (as of August 7, 2025)
Chart Pattern: Symmetrical Triangle
Technical View: ⭐⭐⭐⭐ Neutral-to-Positive (Educational Purpose Only)
________________________________________
🔍 What’s Happening on the Chart?
BLUE STAR has formed a Symmetrical Triangle – a pattern where price moves within narrowing highs and lows 📉📈
This indicates consolidation and usually results in a strong breakout or breakdown.
📦 Triangle Range: ~₹1,616 to ₹1,922
👉 Current price is testing the upper edge — a breakout could be brewing!
________________________________________
🕯️ Candle & Indicator Analysis (Simplified)
Here’s what the chart and indicators show:
EMA 200 Crossover:
✅ Bullish signal – price is trading above its 200 EMA
RSI (~60):
🔼 Showing strength – not yet overbought
Stochastic (~92):
🚀 Near overbought – buyers in control
MACD:
⚠️ Still bearish – momentum confirmation is pending
VWAP:
✅ Aligned with bullish bias — suggests institutional support
📊 Volume Breakout:
🔺 Volume surged to 1.57 million, almost 3x the average of ~525.73k — a strong sign that big players may be stepping in as price nears breakout levels.
🧠 Trading Insight:
The chart looks bullish but still needs confirmation. Watch for a proper breakout above the triangle with volume.
________________________________________
📰 Recent News & Sentiment Update
Q1 FY26 Results (as of June 30, 2025):
📈 Total Income: ₹2,998.32 Cr (↑ 3.8% YoY)
💰 Net Profit: ₹122.23 Cr
(Source: Company Filings & Analyst Coverage)
Sentiment:
✅ Positive: Modest earnings growth, analyst support
⚠️ Caution: Target cut by some analysts — signals mixed expectations
________________________________________
🧭 Support & Resistance Levels
📌 Resistance Zones (Upside watch):
R1: ₹1,866
R2: ₹1,904
R3: ₹2,112 (measured move target)
📌 Support Zones (Downside watch):
S1: ₹1,750
S2: ₹1,680
S3: ₹1,616 (triangle base)
________________________________________
🔍 How to Trade a Symmetrical Triangle
A symmetrical triangle is a neutral pattern.
The breakout confirms direction:
– Above = potential upside 🟢
– Below = potential downside 🔴
📈 If Bullish Breakout Happens (above ₹1,860):
✅ Wait for a candle close above ₹1,860 with volume
🎯 Possible Price Zones: ₹2,000 → ₹2,165
🛑 Stop Loss: ₹1,750 (below triangle support)
📉 If Bearish Breakdown Happens (below ₹1,680):
✅ Wait for close below ₹1,680
🎯 Possible Price Zones: ₹1,500 → ₹1,375
🛑 Stop Loss: ₹1,750 (above triangle resistance)
________________________________________
🧠 STWP’s Educational Trade Idea (Not a Recommendation)
🎯 Long watch above: ₹1,839
🛑 Stop Loss: ₹1,719.50
📈 Risk-Reward Idea: Minimum 1:1; ideally aim for 1:2+
________________________________________
🔰 Trading Notes
✅ Always use stop losses
⏳ Be patient — wait for confirmation, not assumption
🚫 Don’t chase green candles or panic in red ones
📚 Trade based on structure, not emotions
💼 Risk only 1–2% of your capital per trade
🎯 Target minimum 1:1.5 Risk-to-Reward ratio
________________________________________
⚠️ Disclaimer (Read Carefully)
This post is for educational and informational purposes only.
The author is not a SEBI-registered investment advisor. No buy or sell recommendations are being made.
All views are based on chart patterns, publicly available data, and personal learning experience.
Trading involves risk. Losses can exceed your investment. Always consult a SEBI-registered advisor before making financial decisions.
By engaging with this content, you agree to these terms.
________________________________________
💬 Was this useful?
Drop your thoughts, questions, or setups in the comments below ⬇️ — let’s grow together!
🔁 Share this post with fellow traders and beginners to spread clean, structure-based learning.
✅ Follow simpletradewithpatience for beginner-friendly setups, price action insights, and disciplined trading content.
🚀 Stay Calm. Stay Clean. Trade With Patience.
Trade Smart | Learn Zones | Be Self-Reliant 📊
________________________________________
📊 BLUE STAR LTD – Beginner-Friendly Technical & Fundamental Snapshot
Ticker: NSE:BLUESTARCO | Sector: Consumer Durables
CMP: ₹1,827.50 ▲ (+3.23%) (as of August 7, 2025)
Chart Pattern: Symmetrical Triangle
Technical View: ⭐⭐⭐⭐ Neutral-to-Positive (Educational Purpose Only)
________________________________________
🔍 What’s Happening on the Chart?
BLUE STAR has formed a Symmetrical Triangle – a pattern where price moves within narrowing highs and lows 📉📈
This indicates consolidation and usually results in a strong breakout or breakdown.
📦 Triangle Range: ~₹1,616 to ₹1,922
👉 Current price is testing the upper edge — a breakout could be brewing!
________________________________________
🕯️ Candle & Indicator Analysis (Simplified)
Here’s what the chart and indicators show:
EMA 200 Crossover:
✅ Bullish signal – price is trading above its 200 EMA
RSI (~60):
🔼 Showing strength – not yet overbought
Stochastic (~92):
🚀 Near overbought – buyers in control
MACD:
⚠️ Still bearish – momentum confirmation is pending
VWAP:
✅ Aligned with bullish bias — suggests institutional support
📊 Volume Breakout:
🔺 Volume surged to 1.57 million, almost 3x the average of ~525.73k — a strong sign that big players may be stepping in as price nears breakout levels.
🧠 Trading Insight:
The chart looks bullish but still needs confirmation. Watch for a proper breakout above the triangle with volume.
________________________________________
📰 Recent News & Sentiment Update
Q1 FY26 Results (as of June 30, 2025):
📈 Total Income: ₹2,998.32 Cr (↑ 3.8% YoY)
💰 Net Profit: ₹122.23 Cr
(Source: Company Filings & Analyst Coverage)
Sentiment:
✅ Positive: Modest earnings growth, analyst support
⚠️ Caution: Target cut by some analysts — signals mixed expectations
________________________________________
🧭 Support & Resistance Levels
📌 Resistance Zones (Upside watch):
R1: ₹1,866
R2: ₹1,904
R3: ₹2,112 (measured move target)
📌 Support Zones (Downside watch):
S1: ₹1,750
S2: ₹1,680
S3: ₹1,616 (triangle base)
________________________________________
🔍 How to Trade a Symmetrical Triangle
A symmetrical triangle is a neutral pattern.
The breakout confirms direction:
– Above = potential upside 🟢
– Below = potential downside 🔴
📈 If Bullish Breakout Happens (above ₹1,860):
✅ Wait for a candle close above ₹1,860 with volume
🎯 Possible Price Zones: ₹2,000 → ₹2,165
🛑 Stop Loss: ₹1,750 (below triangle support)
📉 If Bearish Breakdown Happens (below ₹1,680):
✅ Wait for close below ₹1,680
🎯 Possible Price Zones: ₹1,500 → ₹1,375
🛑 Stop Loss: ₹1,750 (above triangle resistance)
________________________________________
🧠 STWP’s Educational Trade Idea (Not a Recommendation)
🎯 Long watch above: ₹1,839
🛑 Stop Loss: ₹1,719.50
📈 Risk-Reward Idea: Minimum 1:1; ideally aim for 1:2+
________________________________________
🔰 Trading Notes
✅ Always use stop losses
⏳ Be patient — wait for confirmation, not assumption
🚫 Don’t chase green candles or panic in red ones
📚 Trade based on structure, not emotions
💼 Risk only 1–2% of your capital per trade
🎯 Target minimum 1:1.5 Risk-to-Reward ratio
________________________________________
⚠️ Disclaimer (Read Carefully)
This post is for educational and informational purposes only.
The author is not a SEBI-registered investment advisor. No buy or sell recommendations are being made.
All views are based on chart patterns, publicly available data, and personal learning experience.
Trading involves risk. Losses can exceed your investment. Always consult a SEBI-registered advisor before making financial decisions.
By engaging with this content, you agree to these terms.
________________________________________
💬 Was this useful?
Drop your thoughts, questions, or setups in the comments below ⬇️ — let’s grow together!
🔁 Share this post with fellow traders and beginners to spread clean, structure-based learning.
✅ Follow simpletradewithpatience for beginner-friendly setups, price action insights, and disciplined trading content.
🚀 Stay Calm. Stay Clean. Trade With Patience.
Trade Smart | Learn Zones | Be Self-Reliant 📊
________________________________________
📊 STWP | Mentor | Demand & Supply Specialist
🎯 Helping you become a self-reliant & independent trader
🎓 Learn more: simpletradewithpatience.com
📲 WhatsApp: wa.me/919987567889
🔍 Trade with Clarity. Learn with Patience.
🎯 Helping you become a self-reliant & independent trader
🎓 Learn more: simpletradewithpatience.com
📲 WhatsApp: wa.me/919987567889
🔍 Trade with Clarity. Learn with Patience.
Penafian
Maklumat dan penerbitan adalah tidak dimaksudkan untuk menjadi, dan tidak membentuk, nasihat untuk kewangan, pelaburan, perdagangan dan jenis-jenis lain atau cadangan yang dibekalkan atau disahkan oleh TradingView. Baca dengan lebih lanjut di Terma Penggunaan.