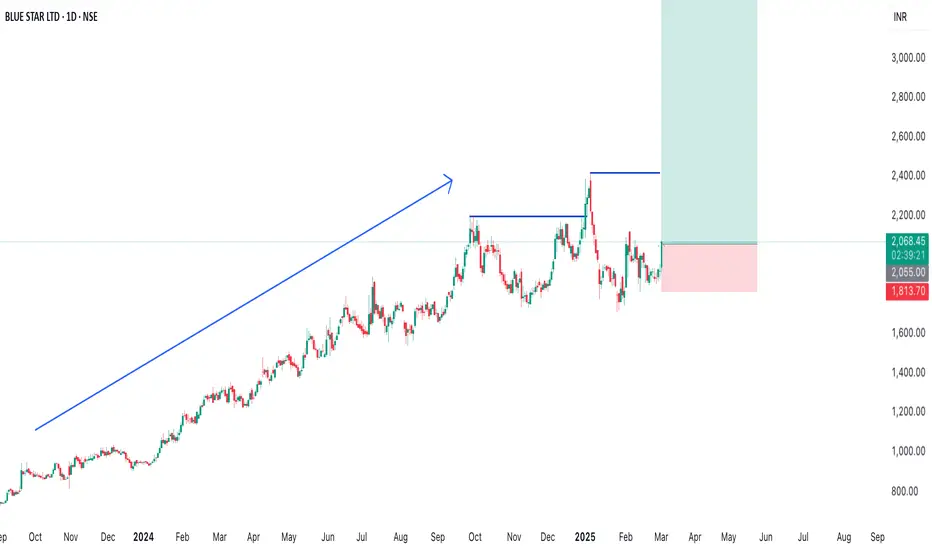
Based on the recent price action of Blue Star Ltd. (BLUESTARCO), the stock has shown mixed performance with some bullish indicators:
1. As of March 3, 2025, BLUESTARCO closed at 1,879.30, which is 22.25% below its 52-week high of 2,417.00 set on January 6, 2025.
2. The stock has been experiencing some volatility, with recent trading sessions showing both upward and downward movements:
o On February 23, 2025, the price moved down by 1.24% to 1,890.00
o On February 27, 2025, the trading volume exceeded the daily average by 15.06%
3. Technical indicators present a mixed outlook:
o Short-term moving averages (5, 10, 20-day SMAs) are showing bullish signals
o Long-term moving averages (50, 100, 200-day SMAs) are also indicating bullish trends
o The Relative Strength Index (RSI) and other momentum indicators are suggesting bullish momentum
4. The stock formed a cup and handle pattern between June and September 2024, with a breakout occurring on September 23, 2024, supported by strong trading volume
5. Current market price (1,973.6 INR) is considered overvalued by 47% compared to the calculated intrinsic value of 1,053.27 INR
6. Wall Street analysts have set an average 1-year price target of 1,932.01 INR, with a low forecast of 1,376.63 INR and a high forecast of 2,415 INR
Overall, while BLUESTARCO has shown some positive technical indicators and patterns, it's currently trading below its recent highs and is considered overvalued by some metrics. Investors should carefully consider these factors along with fundamental analysis before making any investment decisions.
Penafian
Maklumat dan penerbitan adalah tidak dimaksudkan untuk menjadi, dan tidak membentuk, nasihat untuk kewangan, pelaburan, perdagangan dan jenis-jenis lain atau cadangan yang dibekalkan atau disahkan oleh TradingView. Baca dengan lebih lanjut di Terma Penggunaan.
Penafian
Maklumat dan penerbitan adalah tidak dimaksudkan untuk menjadi, dan tidak membentuk, nasihat untuk kewangan, pelaburan, perdagangan dan jenis-jenis lain atau cadangan yang dibekalkan atau disahkan oleh TradingView. Baca dengan lebih lanjut di Terma Penggunaan.