BNB/USDT Weekly Chart Update
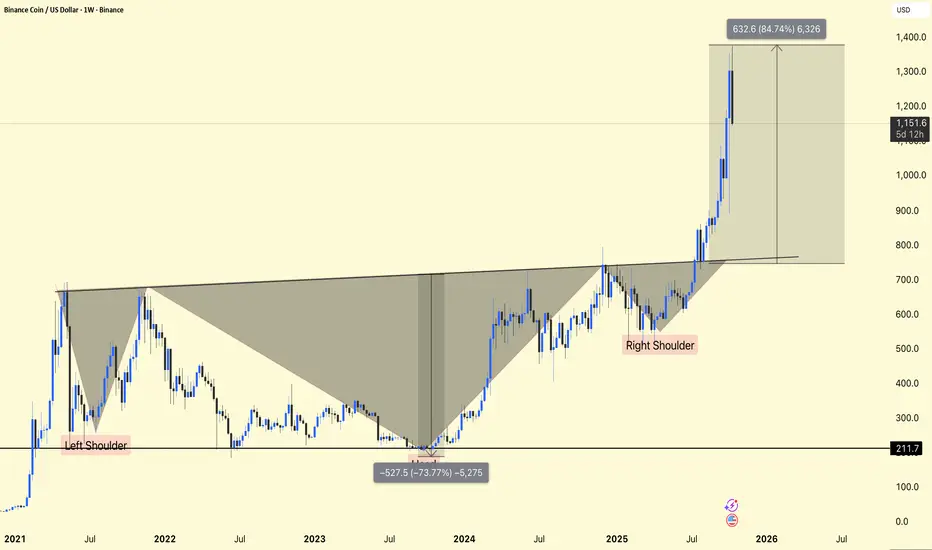
BNB has completed a massive inverse head and shoulders pattern on the weekly timeframe – a strong bullish reversal structure that confirms the long-term uptrend.
After breaking the $750 neckline, the price quickly rose to $1,230+, representing a gain of approximately +85% from the breakout zone. Current price activity remains strong, but a short-term decline towards $1,000-$1,100 would be good for continued downside.
Support: $800-$850 (neckline retest zone)
Short-term support: $1,000-$1,100
Target area: $1,350-$1,400
The breakout structure is bullish and intact – declines can be viewed as accumulation opportunities for the next leg up.
DYOR | NFA
Penerbitan berkaitan
Penafian
Maklumat dan penerbitan adalah tidak bertujuan, dan tidak membentuk, nasihat atau cadangan kewangan, pelaburan, dagangan atau jenis lain yang diberikan atau disahkan oleh TradingView. Baca lebih dalam Terma Penggunaan.
Penerbitan berkaitan
Penafian
Maklumat dan penerbitan adalah tidak bertujuan, dan tidak membentuk, nasihat atau cadangan kewangan, pelaburan, dagangan atau jenis lain yang diberikan atau disahkan oleh TradingView. Baca lebih dalam Terma Penggunaan.