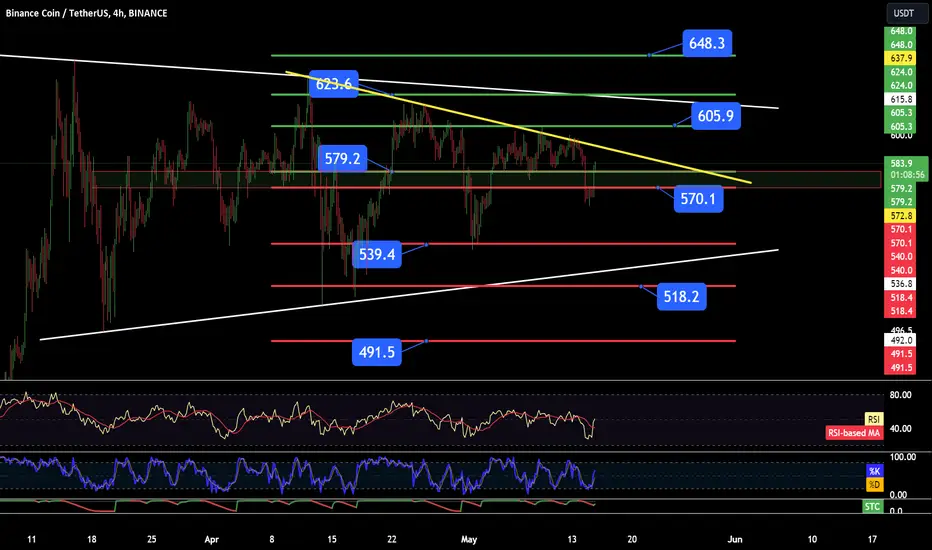
Hello everyone, let's look at the 4H BNB to USDT chart, in this situation we can see how the price is moving in a sideways trend channel, staying below the local downtrend line.
Let's start by setting goals for the near future that we can include:
T1 = USD 579.2 at which the price struggles
T2 = $605.9
T3 = $623.6
AND
T4 = $648.3
Now let's move on to the stop-loss in case of further market declines:
SL1 = $570.1
SL2 = $539.4
SL3 = $518.2
AND
SL4 = $491.50
Let's start by setting goals for the near future that we can include:
T1 = USD 579.2 at which the price struggles
T2 = $605.9
T3 = $623.6
AND
T4 = $648.3
Now let's move on to the stop-loss in case of further market declines:
SL1 = $570.1
SL2 = $539.4
SL3 = $518.2
AND
SL4 = $491.50
Penafian
Maklumat dan penerbitan adalah tidak bertujuan, dan tidak membentuk, nasihat atau cadangan kewangan, pelaburan, dagangan atau jenis lain yang diberikan atau disahkan oleh TradingView. Baca lebih dalam Terma Penggunaan.
Penafian
Maklumat dan penerbitan adalah tidak bertujuan, dan tidak membentuk, nasihat atau cadangan kewangan, pelaburan, dagangan atau jenis lain yang diberikan atau disahkan oleh TradingView. Baca lebih dalam Terma Penggunaan.