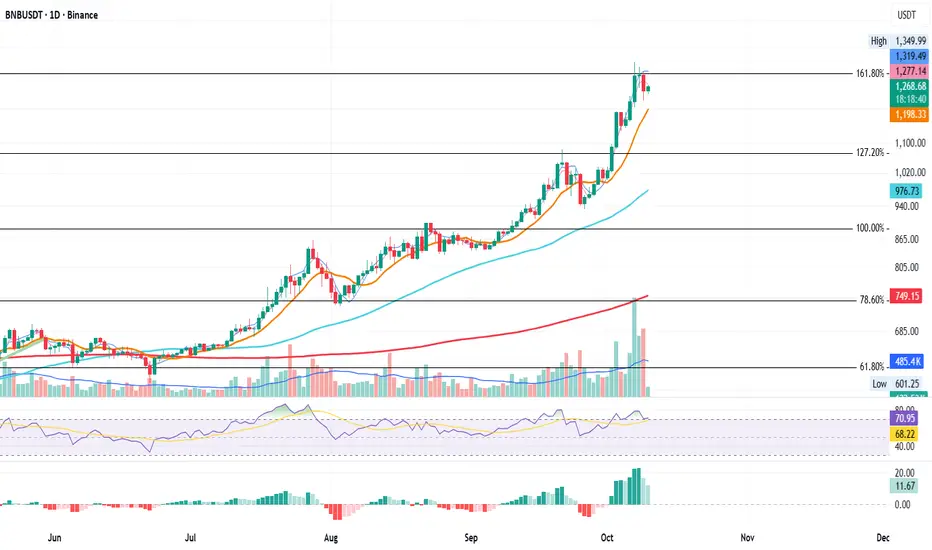
BNB Daily – After the Run, Testing Its Range
Since July, BNB has delivered an impressive rally. Back then, price was sitting near the 61.8% Fibonacci level, and from there it climbed all the way to a new all-time high at the 161.8% Fib extension, which is now acting as resistance.
On October 7 and 8, intraday moves briefly pushed above this level, but both sessions failed to close above it, leading to a clear rejection on October 9, confirmed by a large downside volume bar.
From a system perspective, the structure remains in an uptrend, with MLR > SMA > Price > BBc
indicating that despite the pullback, the broader bullish structure is still valid.
Key levels to watch:
Resistance: 161.8% Fib at $1310
Support: BB Center (orange) at $1198
If BNB can hold above the BB Center, it keeps the upper hand and could attempt another move toward its ATH.
However, a daily close below the BB Center would shift the short-term momentum bearish, opening room for further downside.
Periods like this often decide whether a move becomes continuation or distribution: patience around key levels pays off.
Bias:
Neutral-bullish — uptrend intact, but watching the BB Center closely for confirmation.
Always take profits and manage risk.
Interaction is welcome.
Penafian
Maklumat dan penerbitan adalah tidak dimaksudkan untuk menjadi, dan tidak membentuk, nasihat untuk kewangan, pelaburan, perdagangan dan jenis-jenis lain atau cadangan yang dibekalkan atau disahkan oleh TradingView. Baca dengan lebih lanjut di Terma Penggunaan.
Penafian
Maklumat dan penerbitan adalah tidak dimaksudkan untuk menjadi, dan tidak membentuk, nasihat untuk kewangan, pelaburan, perdagangan dan jenis-jenis lain atau cadangan yang dibekalkan atau disahkan oleh TradingView. Baca dengan lebih lanjut di Terma Penggunaan.