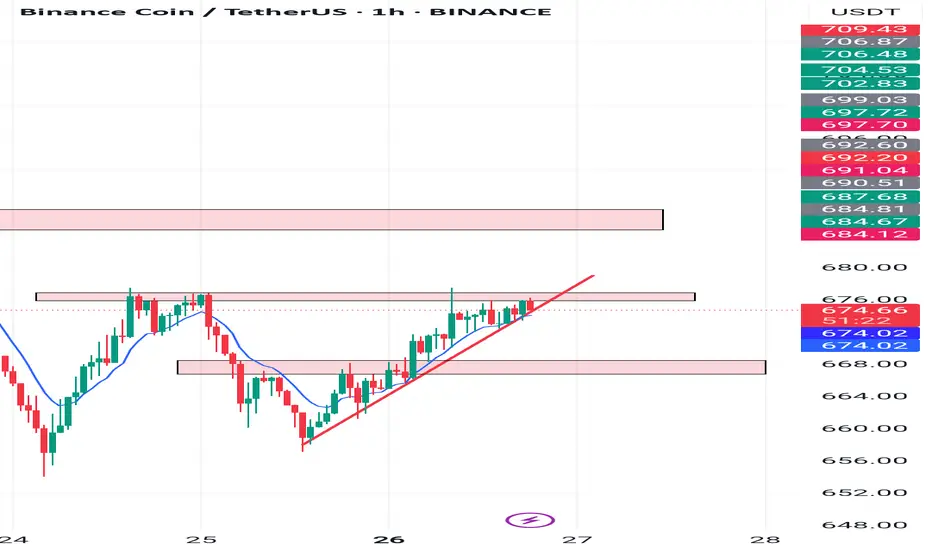
Current Price:
$674.94 (up +0.82%)
Key Observations:
1. Rising Wedge Formation:
Price is moving upward inside a rising wedge, which is generally a bearish pattern.
The price is currently testing the upper resistance zone near $675–$676.
2. Resistance Zone:
Strong resistance zone is marked just above the current price.
This area has previously acted as supply and could trigger a pullback.
3. Support Zones:
First key support is around $668–$670 (lower pink box).
Major support below that is around $660–$663.
4. Moving Average:
Price is trading above the blue moving average, indicating short-term bullish momentum.
Possible Trading Scenarios:
Bearish Setup (More likely due to wedge pattern):
If price gets rejected at the current resistance and breaks below the wedge:
Short Entry: Below $673
Target 1: $668
Target 2: $660
Stop Loss: Above $676
Bullish Breakout Scenario:
If price breaks and closes strongly above $676:
Long Entry: Above $677
Target 1: $684
Target 2: $692
Stop Loss: Below $673
Penafian
Maklumat dan penerbitan adalah tidak dimaksudkan untuk menjadi, dan tidak membentuk, nasihat untuk kewangan, pelaburan, perdagangan dan jenis-jenis lain atau cadangan yang dibekalkan atau disahkan oleh TradingView. Baca dengan lebih lanjut di Terma Penggunaan.
Penafian
Maklumat dan penerbitan adalah tidak dimaksudkan untuk menjadi, dan tidak membentuk, nasihat untuk kewangan, pelaburan, perdagangan dan jenis-jenis lain atau cadangan yang dibekalkan atau disahkan oleh TradingView. Baca dengan lebih lanjut di Terma Penggunaan.