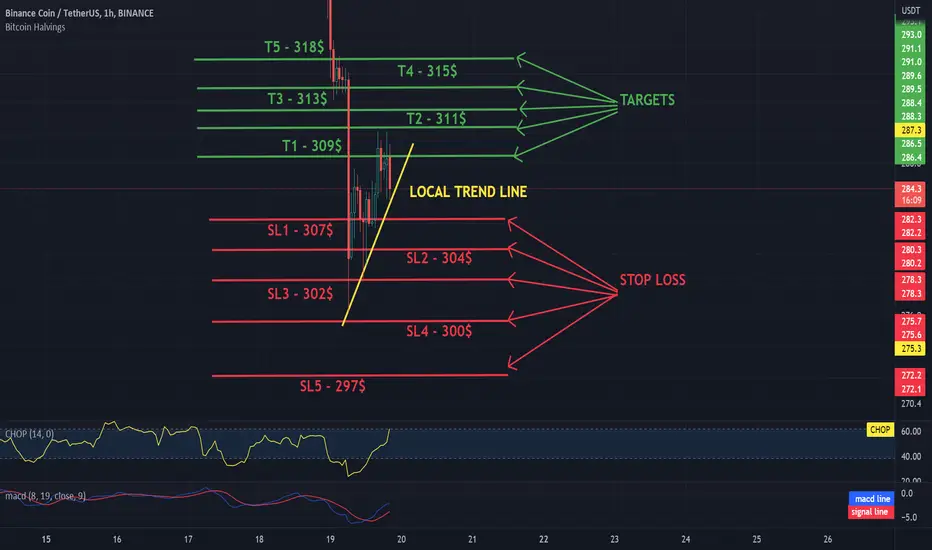
Hello everyone, let's take a look at the 1H BNB to USDT chart as you can see the price is moving with the local uptrend line.
Let's start by setting goals for the near future that we can consider:
T1 - $ 309
T2 - $ 311
T3 - $ 313
T4 - $ 315
and
T5 - $ 318
Now let's move on to the stop loss in case of further market declines:
SL1 - $ 307
SL2 - $ 304
SL3 - $ 302
SL4 - $ 300
and
SL5 - $ 297
Looking at the CHOP indicator, we can see that there is a lot of energy in the 1H range, while the MACD indicator shows a local uptrend.
Penafian
Maklumat dan penerbitan adalah tidak bertujuan, dan tidak membentuk, nasihat atau cadangan kewangan, pelaburan, dagangan atau jenis lain yang diberikan atau disahkan oleh TradingView. Baca lebih dalam Terma Penggunaan.
Penafian
Maklumat dan penerbitan adalah tidak bertujuan, dan tidak membentuk, nasihat atau cadangan kewangan, pelaburan, dagangan atau jenis lain yang diberikan atau disahkan oleh TradingView. Baca lebih dalam Terma Penggunaan.