It is about reading the price pattern and the result of the indicators
I will only share with you what the result of the analysis shows.
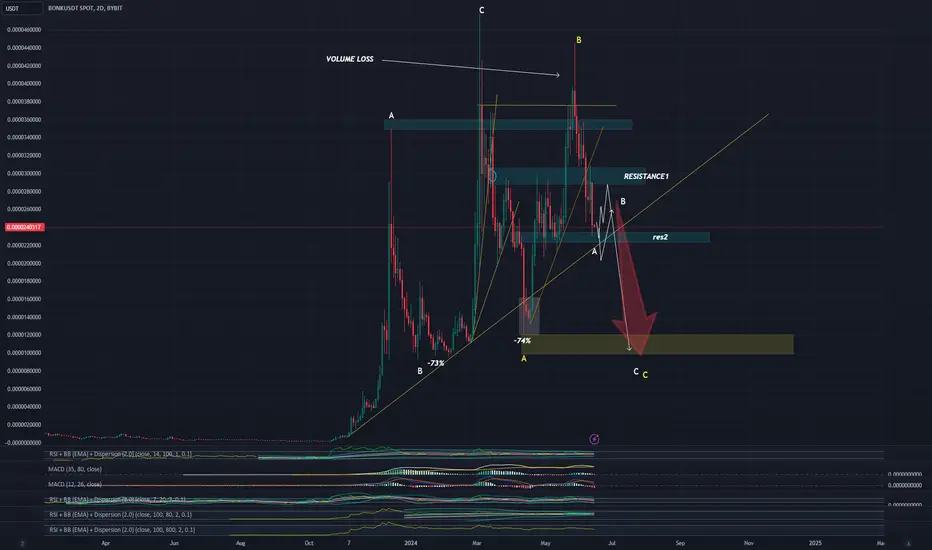
The weirdest coin to apply the abc strategy
This could be wrong. MD
I will only share with you what the result of the analysis shows.
The weirdest coin to apply the abc strategy
This could be wrong. MD
Nota
bonk pump 20%?Nota
On June 11th, bitcoin gave a STRONG SELL SIGNAL THAT HAS NOT BEEN GIVEN IN BITCOIN BEFORE THIS YEAR, detected by my indicators. Given btc price pattern and DELETING ILLUSIONS!! is only a decline.btc stfmodel and btc etf are nice things BUT THERE IS ONLY A BIG BUT
I could be wrong
Nota
bonk feels an resistance today and somewhere it might be point b.
all in all i expect it to -50% with today's price level and if it goes up and point b it will get more down
Nota
mini point b is still real shitNota
I will activate point b somewhere when the rsi is out of the 30 areaNota
point c is not a buy area, but a minimum decline areaX). this shit applies to all coins. maybe point c is big point a XDNota
Fib minimum level?I am not trading this coin today but it is interesting to watchX)
Nota
Nota
Nota
there is no evidence that point b has ended and c is coming.maybe 0.000025 goes up. but maybe not
Nota
Nota
considering that point a moved to rsi7 30 area, it is possible that this will happen again, 30 areaPenafian
Maklumat dan penerbitan adalah tidak dimaksudkan untuk menjadi, dan tidak membentuk, nasihat untuk kewangan, pelaburan, perdagangan dan jenis-jenis lain atau cadangan yang dibekalkan atau disahkan oleh TradingView. Baca dengan lebih lanjut di Terma Penggunaan.
Penafian
Maklumat dan penerbitan adalah tidak dimaksudkan untuk menjadi, dan tidak membentuk, nasihat untuk kewangan, pelaburan, perdagangan dan jenis-jenis lain atau cadangan yang dibekalkan atau disahkan oleh TradingView. Baca dengan lebih lanjut di Terma Penggunaan.