SHORT 
 BROCCOLIUSDT.P from $0.04545
🛡 Stop Loss: $0.04737
🕒 Timeframe: 1H
⚡️ Overview:
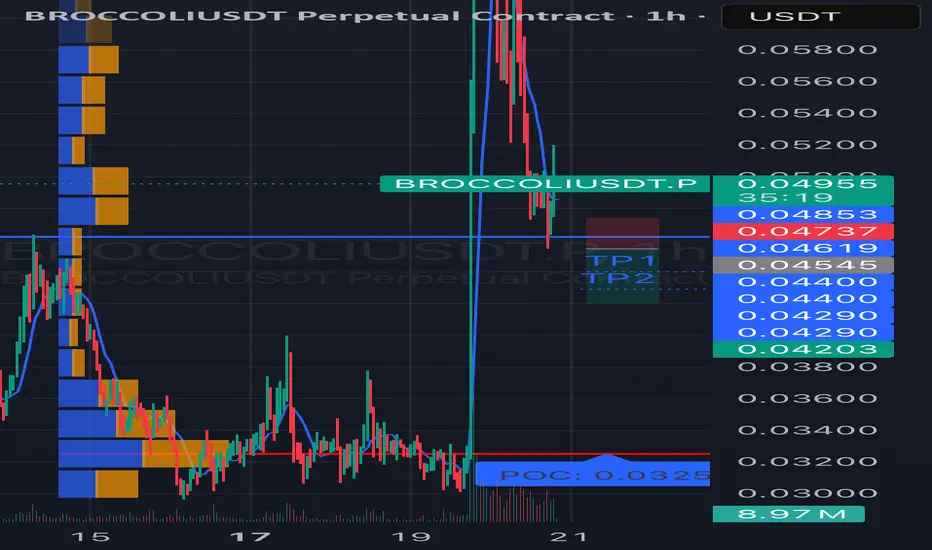
➡️BROCCOLIUSDT.P is showing bearish momentum on the 1-hour timeframe after a significant drop from $0.06000 to the current consolidation zone of $0.4203–$0.4885.
➡️ The price recently tested the $0.04545 level (a possible retest of a broken support, now acting as resistance), which could serve as an entry point for a short.
➡️ The volume profile on the left shows strong buyer interest at $0.0325 (POC), which acts as a key support level. However, the lack of significant buying volume at current levels suggests potential for further downside.
➡️ The price structure remains bearish: lower highs and lows are forming after the drop.
➡️ The RSI (14) indicator on the 1H timeframe is presumably around 45 (based on price action), indicating neutral momentum with room for a downward move.
🎯 Take Profit Targets:
💎 TP 1: $0.04400
💎 TP 2: $0.04290
💎 TP 3: $0.04203
⚡️Plan:
➡️ Entry: Sell below $0.04545 after the 1-hour candle closes below this level to confirm the rejection from resistance.
➡️ Stop Loss: Set at $0.04737, which provides a 7% risk from the entry point and protects against a potential breakout.
➡️ Risk/Reward Ratio: From 1:2 (for TP1) to 1:5 (for TP3), making this trade attractive from a risk management perspective.
➡️ After the drop, the price has stabilized, indicating possible consolidation or accumulation.
➡️ Resistance zone: $0.04885 (upper boundary of the current range).
Technical Indicators:
➡️ The chart shows candles in red and green, reflecting bearish and bullish movements.
➡️ After the sharp decline, the price has formed lower highs and lows, but in recent hours, there’s an attempt at recovery.
📢 A price rejection below $0.04545 with increasing selling volume increases the likelihood of reaching the targets.
📢 The $0.04400 and $0.04290 levels may act as areas for partial profit-taking, so monitor price action in these zones.
📢 Risks: If the price breaks above $0.04885, it could signal a false breakdown and a potential reversal to the upside. In this case, consider reassessing the position.
📊 The decline inBROCCOLIUSDT.P aligns with cautious sentiment in the crypto market.
📊 As of March 20, 2025, BTCUSDT.P is trading around $90,000, showing signs of consolidation, which may pressure altcoins like BROCCOLIUSDT.P
BROCCOLIUSDT.P is showing bearish potential on the 1H timeframe.
⚡️A confirmed rejection below $0.04545 is your signal to act!
🛡 Stop Loss: $0.04737
🕒 Timeframe: 1H
⚡️ Overview:
➡️
➡️ The price recently tested the $0.04545 level (a possible retest of a broken support, now acting as resistance), which could serve as an entry point for a short.
➡️ The volume profile on the left shows strong buyer interest at $0.0325 (POC), which acts as a key support level. However, the lack of significant buying volume at current levels suggests potential for further downside.
➡️ The price structure remains bearish: lower highs and lows are forming after the drop.
➡️ The RSI (14) indicator on the 1H timeframe is presumably around 45 (based on price action), indicating neutral momentum with room for a downward move.
🎯 Take Profit Targets:
💎 TP 1: $0.04400
💎 TP 2: $0.04290
💎 TP 3: $0.04203
⚡️Plan:
➡️ Entry: Sell below $0.04545 after the 1-hour candle closes below this level to confirm the rejection from resistance.
➡️ Stop Loss: Set at $0.04737, which provides a 7% risk from the entry point and protects against a potential breakout.
➡️ Risk/Reward Ratio: From 1:2 (for TP1) to 1:5 (for TP3), making this trade attractive from a risk management perspective.
➡️ After the drop, the price has stabilized, indicating possible consolidation or accumulation.
➡️ Resistance zone: $0.04885 (upper boundary of the current range).
Technical Indicators:
➡️ The chart shows candles in red and green, reflecting bearish and bullish movements.
➡️ After the sharp decline, the price has formed lower highs and lows, but in recent hours, there’s an attempt at recovery.
📢 A price rejection below $0.04545 with increasing selling volume increases the likelihood of reaching the targets.
📢 The $0.04400 and $0.04290 levels may act as areas for partial profit-taking, so monitor price action in these zones.
📢 Risks: If the price breaks above $0.04885, it could signal a false breakdown and a potential reversal to the upside. In this case, consider reassessing the position.
📊 The decline in
📊 As of March 20, 2025,
⚡️A confirmed rejection below $0.04545 is your signal to act!
🔥Subscribe to our Telegram channel🔥
🔥Every day 1 FREE signal 🔥
🔗 tinyurl.com/GoToMoriartyTradeGlobal
🔥Every day 1 FREE signal 🔥
🔗 tinyurl.com/GoToMoriartyTradeGlobal
Penerbitan berkaitan
Penafian
The information and publications are not meant to be, and do not constitute, financial, investment, trading, or other types of advice or recommendations supplied or endorsed by TradingView. Read more in the Terms of Use.