📈 Daily Technical Indicators
RSI (14-day): 57.72 — Indicates a neutral to bullish momentum.
MACD: -19.21 — Suggests mild bearishness.
Stochastic Oscillator: 83.13 — Approaching overbought territory, implying caution.
Average True Range (ATR): Indicates low volatility, suggesting a stable trading environment.
ADX (14-day): 26.07 — Reflects a moderately strong trend.
🔄 Short-Term Outlook
On the 1-hour chart, BSE Ltd. is exhibiting a "Strong Sell" signal across both technical indicators and moving averages. This suggests a prevailing short-term downtrend, with the stock trading below its key moving averages.
📊 Key Levels to Watch
Support Levels: ₹2,230 (recent low) and ₹2,121 (intraday low).
Resistance Levels: ₹2,281 (recent high) and ₹2,300 (target price set by IIFL Capital).
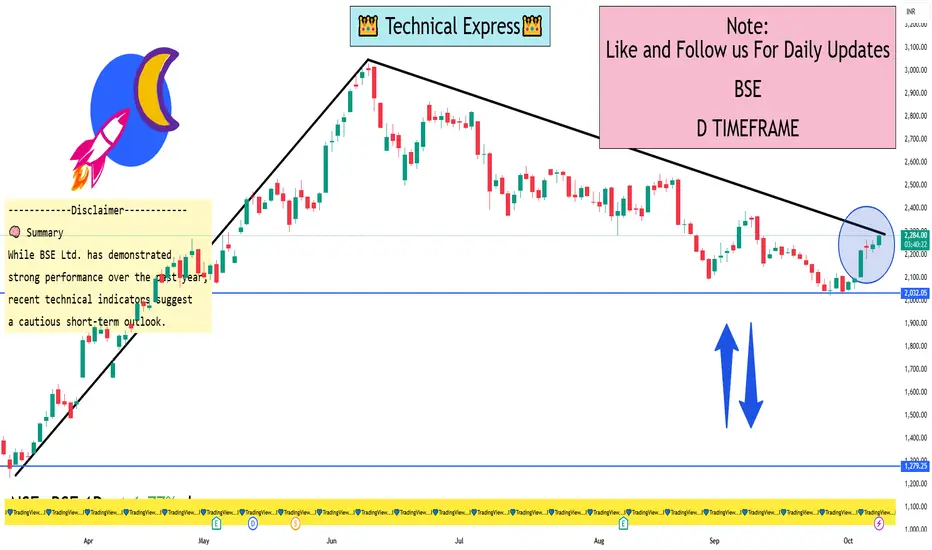
🧠 Summary
While BSE Ltd. has demonstrated strong performance over the past year, recent technical indicators suggest a cautious short-term outlook. Traders should monitor key support and resistance levels closely and consider market conditions before making investment decisions.
RSI (14-day): 57.72 — Indicates a neutral to bullish momentum.
MACD: -19.21 — Suggests mild bearishness.
Stochastic Oscillator: 83.13 — Approaching overbought territory, implying caution.
Average True Range (ATR): Indicates low volatility, suggesting a stable trading environment.
ADX (14-day): 26.07 — Reflects a moderately strong trend.
🔄 Short-Term Outlook
On the 1-hour chart, BSE Ltd. is exhibiting a "Strong Sell" signal across both technical indicators and moving averages. This suggests a prevailing short-term downtrend, with the stock trading below its key moving averages.
📊 Key Levels to Watch
Support Levels: ₹2,230 (recent low) and ₹2,121 (intraday low).
Resistance Levels: ₹2,281 (recent high) and ₹2,300 (target price set by IIFL Capital).
🧠 Summary
While BSE Ltd. has demonstrated strong performance over the past year, recent technical indicators suggest a cautious short-term outlook. Traders should monitor key support and resistance levels closely and consider market conditions before making investment decisions.
I built a Buy & Sell Signal Indicator with 85% accuracy.
📈 Get access via DM or
WhatsApp: wa.link/d997q0
| Email: techncialexpress@gmail.com
| Script Coder | Trader | Investor | From India
📈 Get access via DM or
WhatsApp: wa.link/d997q0
| Email: techncialexpress@gmail.com
| Script Coder | Trader | Investor | From India
Penerbitan berkaitan
Penafian
Maklumat dan penerbitan adalah tidak dimaksudkan untuk menjadi, dan tidak membentuk, nasihat untuk kewangan, pelaburan, perdagangan dan jenis-jenis lain atau cadangan yang dibekalkan atau disahkan oleh TradingView. Baca dengan lebih lanjut di Terma Penggunaan.