Hello
It's a Bitcoin Guide.
If you "follow"
You can receive real-time movement paths and comment notifications on major sections.
If my analysis was helpful,
Please click the booster button at the bottom.

This is the Nasdaq 30-minute chart.
There are no separate indicators released.
Roughly speaking,
the strategy is to switch from short to long at the light blue finger, or to wait long at the bottom.
The bottom is today's major support line and the 6+12 pattern recovery point.
If the price moves along the light blue finger path,
there's a possibility that it will eventually fall to touch the 6+12 level again.
Please note this.
I applied this directly to Bitcoin.

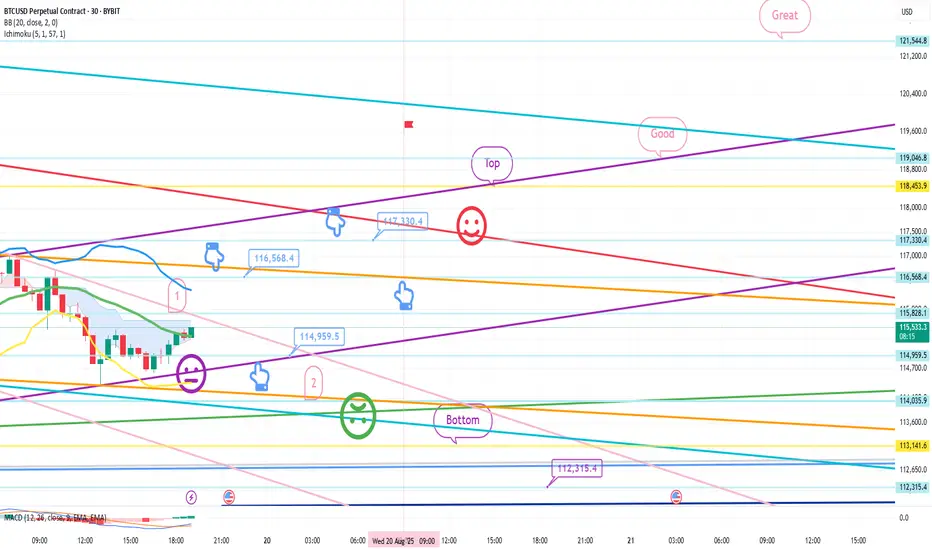
This is a 30-minute Bitcoin chart.
The Nasdaq is moving sideways in a downward trend,
while Bitcoin has continued its vertical decline after hitting a new high.
*If the blue finger moves along the path,
switch from short to long. Or, if it immediately declines, wait long in the second section.
This is a two-way neutral strategy.
1. $116,568.4 short position entry point / Stop loss price if the orange resistance line is broken.
2. $114,959.5 long position switch / Stop loss price if the purple support line is broken.
3. $117,330.4 long position first target / 116.5K long position re-entry point.
After this, long position target prices are listed in order of Top, Good, and Great.
The first point above is the best short position entry point for today.
If the price declines around the first touch, hold long at the second point.
Stop loss price if the green support line is broken.
In the case of Bitcoin, the candlestick is breaking out of the 12+ daily pattern,
and the downside is open.
If the bottom point is maintained, the mid-term uptrend will be broken.
-> If the bottom point is broken out, the mid-term uptrend will be broken. A medium-term downtrend may be forming.
(MACD dead cross on weekly chart)
If the Nasdaq only moves sideways, that's good,
but if it declines, BTC could fall even more sharply.
Due to low participation, I decided to take a break this week,
but I've had some free time, so I'm sharing this with everyone for the first time in a while.
Please use my analysis for reference only.
I hope you operate safely, with a focus on principled trading and stop-loss orders.
Thank you.
It's a Bitcoin Guide.
If you "follow"
You can receive real-time movement paths and comment notifications on major sections.
If my analysis was helpful,
Please click the booster button at the bottom.
This is the Nasdaq 30-minute chart.
There are no separate indicators released.
Roughly speaking,
the strategy is to switch from short to long at the light blue finger, or to wait long at the bottom.
The bottom is today's major support line and the 6+12 pattern recovery point.
If the price moves along the light blue finger path,
there's a possibility that it will eventually fall to touch the 6+12 level again.
Please note this.
I applied this directly to Bitcoin.
This is a 30-minute Bitcoin chart.
The Nasdaq is moving sideways in a downward trend,
while Bitcoin has continued its vertical decline after hitting a new high.
*If the blue finger moves along the path,
switch from short to long. Or, if it immediately declines, wait long in the second section.
This is a two-way neutral strategy.
1. $116,568.4 short position entry point / Stop loss price if the orange resistance line is broken.
2. $114,959.5 long position switch / Stop loss price if the purple support line is broken.
3. $117,330.4 long position first target / 116.5K long position re-entry point.
After this, long position target prices are listed in order of Top, Good, and Great.
The first point above is the best short position entry point for today.
If the price declines around the first touch, hold long at the second point.
Stop loss price if the green support line is broken.
In the case of Bitcoin, the candlestick is breaking out of the 12+ daily pattern,
and the downside is open.
If the bottom point is maintained, the mid-term uptrend will be broken.
-> If the bottom point is broken out, the mid-term uptrend will be broken. A medium-term downtrend may be forming.
(MACD dead cross on weekly chart)
If the Nasdaq only moves sideways, that's good,
but if it declines, BTC could fall even more sharply.
Due to low participation, I decided to take a break this week,
but I've had some free time, so I'm sharing this with everyone for the first time in a while.
Please use my analysis for reference only.
I hope you operate safely, with a focus on principled trading and stop-loss orders.
Thank you.
Dagangan ditutup secara manual
Hello,It's a Bitcoin Guide.
I'll check the movement since writing the analysis on August 19th.
This is a 30-minute chart of the Nasdaq.
I've marked the major sections with black fingers.
Since a lot of time has passed, I've tried to organize it into one screen.
The light blue finger indicates a short->long or long-waiting strategy in section 1.
A vertical drop occurred without touching the short entry point at the top.
Ignoring the major rebound section at the bottom,
the price fell to 23.4K at the light blue support line and closed.
After falling to 22,967.7 points over the past hour, including the weekend,
it has completed a retracement to section 1. This move reestablished the 12+-day pattern,
and if the current high is not broken,
the weekly MACD dead cross pressure may continue.
This is a 30-minute Bitcoin chart.
The main sections are marked with black fingers.
Similar to the Nasdaq, the light blue fingers indicate a short-to-long switching strategy
or a long-waiting strategy at the bottom.
As explained,
after touching the best short entry point at the top, the first section at $115,828.1,
it fell vertically to the bottom and closed.
(From the best short section at the top, the price fell approximately $3,500 to the 112.3K level marked below.)
I asked the Nasdaq to stop the decline,
but it did, and the pairing occurred.
The strategy involved manual liquidation.
Afterwards, it touched the low point indicated below, $112,315.4, and without breaking away from the deep blue support line, it successfully rebounded to the light blue target area indicated above, $117,330.4.
(A $5,000 rebound from $112.3K to $117.3K).
Afterwards, it fell sharply, leaving a gap of $117K at the top.
After a rebound from the lower tail at $110,805.1, it is now moving sideways.
The weekly MACD death cross, which was a warning signal last week, has been recognized,
but there still seem to be many issues to be resolved, including the possibility of a Nasdaq decline and the possibility of a breakout from Bitcoin's mid-term pattern.
It's been a while since I've published a full analysis article,
and the market has become quite difficult.
I hope you'll all practice principled trading from your respective positions.
Thank you.
Nota
Hello,It's a Bitcoin Guide.
I'll check the movement since writing the analysis on August 25th.
This is the Nasdaq 30-minute chart.
I've marked the key areas with black fingers.
After touching the purple finger at the top,
I took a long position at the red finger's first area.
It appeared to break through the orange resistance line without breaking the purple support line,
but it moved sideways in an unusual pattern and ended in a downward sideways trend.
As I explained in yesterday's analysis,
if the current high is not broken,
a MACD death cross on the weekly chart awaits.
Furthermore, yesterday's movement resulted in a thin bullish cloud on the 4-hour chart and a MACD death cross.
This is the Bitcoin 30-minute chart. I've marked the key sections with black fingers.
On the left, with the purple finger,
I followed the strategy, which was the final long position entry point on the 19th, at $110,805.1.
Based on the purple finger touches at the top,
I'll summarize the short-to-long switching strategy in order:
1. While maintaining the 110.8K level, the first touch of the purple support line (creating a double bottom)
and a successful rebound without any deviation.
2. Touched the short position entry point at the top, at $112,257.9 (the first section),
(Because it was a double bottom, there was a high possibility of a continued upward movement,
but if you look at the chart, you'll see that the same downward wave occurred at the same time as the Nasdaq.)
3. After reaching the long position switching point at $110,327.1,
the 5-minute trend reversal failed (I summarized this in real-time comments this morning).
4. Finally, the bottom was touched and a slight rebound is underway.
Since the short position failed to rebound,
the strategy was to manually liquidate.
(After short entry, it fell to $3,300 -> After bottoming, it rose to around $1,600.)
Yesterday, there was a high possibility of a strong rally from the short position,
but the Nasdaq decline was the biggest variable.
I told you not to let it fall, but if the Nasdaq falls,
it seems inevitable.
Bitcoin is also nearing its final defensive line.
If it fails to rebound in this area,
it will likely continue to correct and decline until the end of this year or early next year.
Please keep this in mind and
I hope you operate safely with a principled trading strategy.
Thank you.
Nota
Hello,It's a Bitcoin Guide.
I'll check the movement after writing the analysis on August 26th.
This is a 30-minute chart for the Nasdaq.
Key areas are marked with black fingers.
The light blue fingers represent the short->long switching strategy.
At the top, a short at 23446.1 was switched to a long at 23372.
(If you look at the 15-minute chart, you can see that the short was placed first.)
The target price of 23509 was reached.
Unfortunately, it didn't reach the top.
After a new daily candle was created today,
it first touched the lower Bollinger Band.
This is a 30-minute chart for Bitcoin.
Key areas are marked with black fingers.
In the red finger long position strategy,
Short $110,684.6 at the top (purple finger 1) -> Long $109,950.4 switch.
Unfortunately, the price rebounded just short of the $112,541.3 target price at the top.
The price is now rebounding from the long position re-entry zone (section 1).
The strategy is active.
I'll summarize the details in the analysis article.
I'll continue to work hard today.
Thank you.
Nota
Hello,It's a Bitcoin Guide.
I'll check the movement since the analysis was posted on August 27th.
This is the Nasdaq 30-minute chart.
I've marked the major sections with black fingers.
The light blue finger indicates a short->long or, if it falls first,
the red finger indicates a 2-point long position waiting strategy.
It fell immediately without touching the short entry point at the top,
*Red finger 2-point 23,435.3 Long position entry completed.
The light blue finger at the top indicates a long position target of 23,595.8.
The Nasdaq is continuing its perfect performance, following the analysis posted two days ago on the 26th.
It fluctuated significantly up and down in the early morning hours,
and a new daily candlestick was created,
and a rebound is underway.
This is a 30-minute Bitcoin chart.
I've marked key areas with black fingers.
In the analysis article on the 26th, in the lower left corner, I've linked the strategy after switching from a short position of 110.6K (purple finger) to a long position of 109.9K (purple finger).
In the long-hold strategy with the red finger,
the price strongly broke through the first rising wave of the purple finger at the top,
but narrowly missed the $110,736 long position entry point at the bottom, and rose to near the top.
Unfortunately, the strategy was canceled because the entry point was not touched.
For those who entered a long position on the 26th and have been holding it,
it's rising slightly to $3,500.
The strategy on the 26th ended in a sideways movement,
but yesterday's action perfectly achieved it.
Since two days ago, I've been playing around, unable to touch the top, just by a hair's breadth.
Ultimately, it's going to follow the chart.
Many experts seem to be predicting a downtrend,
but I'll stick to a neutral, trend-following strategy.
Thank you.
*비트코인가이드 공식텔레그램 Telegram
t.me/BTG_Group
*빙엑스 BingX 50%DC+$5,000 (총1회수수료)
bingx.com/invite/YBM3A4
*바이비트 Bybit 20%DC+$5,020
partner.bybit.com/b/Bitcoin_Guide
*앞으로는 하단의 네이버카페에서만 활동합니다.
cafe.naver.com/loanlife82
t.me/BTG_Group
*빙엑스 BingX 50%DC+$5,000 (총1회수수료)
bingx.com/invite/YBM3A4
*바이비트 Bybit 20%DC+$5,020
partner.bybit.com/b/Bitcoin_Guide
*앞으로는 하단의 네이버카페에서만 활동합니다.
cafe.naver.com/loanlife82
Penerbitan berkaitan
Penafian
Maklumat dan penerbitan adalah tidak bertujuan, dan tidak membentuk, nasihat atau cadangan kewangan, pelaburan, dagangan atau jenis lain yang diberikan atau disahkan oleh TradingView. Baca lebih dalam Terma Penggunaan.