Hello
It's a Bitcoin Guide.
If you "follow"
You can receive real-time movement paths and comment notifications on major sections.
If my analysis was helpful,
Please click the booster button at the bottom.

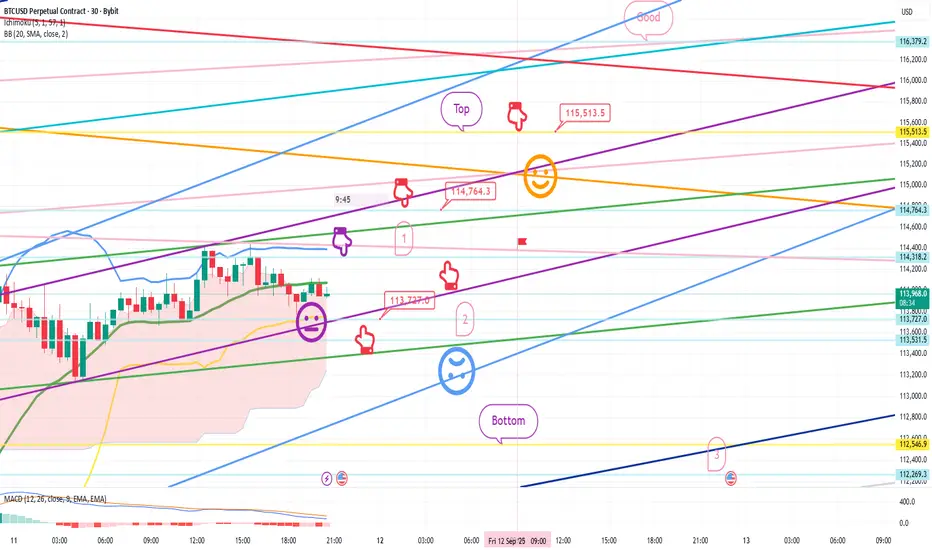
This is Bitcoin's 30-minute chart.
The CPI indicator will be released shortly at 9:30 AM.
I implemented the strategy based on Nasdaq movements.
*When the red finger moves,
Long position strategy
Confirm the upward wave by touching the first section above (autonomous shorting)
1. $113,727 long position entry point / Stop loss if the light blue support line is broken
2. $114,764.3 long position 1st target -> Top 2nd -> Good 3rd target
If the daily candlestick forms before 9:00 AM tomorrow,
you can switch to a short position if the top section is touched.
You can also use the first section shown as a long position switching point.
If the price falls immediately without touching the purple finger at the top, the final long position is at the second level. The strategy was to place a stop-loss order from the breakout of the light blue support line until the possibility of a sideways movement.
From the breakout of the light blue support line, the price opens up to the bottom -> level 3, so long positions should be cautious.
Please use my analysis to this point for reference only.
I hope you operate safely, adhering to principled trading and a stop-loss order.
Thank you.
It's a Bitcoin Guide.
If you "follow"
You can receive real-time movement paths and comment notifications on major sections.
If my analysis was helpful,
Please click the booster button at the bottom.
This is Bitcoin's 30-minute chart.
The CPI indicator will be released shortly at 9:30 AM.
I implemented the strategy based on Nasdaq movements.
*When the red finger moves,
Long position strategy
Confirm the upward wave by touching the first section above (autonomous shorting)
1. $113,727 long position entry point / Stop loss if the light blue support line is broken
2. $114,764.3 long position 1st target -> Top 2nd -> Good 3rd target
If the daily candlestick forms before 9:00 AM tomorrow,
you can switch to a short position if the top section is touched.
You can also use the first section shown as a long position switching point.
If the price falls immediately without touching the purple finger at the top, the final long position is at the second level. The strategy was to place a stop-loss order from the breakout of the light blue support line until the possibility of a sideways movement.
From the breakout of the light blue support line, the price opens up to the bottom -> level 3, so long positions should be cautious.
Please use my analysis to this point for reference only.
I hope you operate safely, adhering to principled trading and a stop-loss order.
Thank you.
Dagangan ditutup: sasaran tercapai
Hello,It's a Bitcoin Guide.
I'll check the movement after writing the analysis on September 11th.
This is a 30-minute chart of the Nasdaq.
I've marked the major sections with black fingers.
The red finger indicates a long position strategy:
At the top:
Purple finger: Short at 23,936.9 points in section 1.
Red finger: Long position switch at 23,858.4 points in section 2.
Without breaking the green support line,
the first target price of 23,974.6 points was reached and the price closed.
The CPI transition from short to long was perfectly executed.
This is a 30-minute chart of Bitcoin. I've marked the key areas with black fingers.
Similar to the Nasdaq, in the red finger long position strategy,
*Purple finger at the top, section 1 / After entering a short position at $114,318.2,
without breaking through the pink resistance line
Red finger at the bottom, section 113.7K -> section 2, section 113,531.5,
without breaking through the green support line
Target price at the top, section 114.7K -> Strongly broke through the top, section 115,513.5.
A strong rebound occurred, just short of the "good" section.
The strategy was taken profit.
It turned out perfectly.
Luckily, the movement followed the Nasdaq pattern, which I'm satisfied with.
The range of fluctuations was approximately $3,500.
I'm not sure if everyone utilized it effectively in the public analysis.
Have a good weekend and see you next time.
Thank you.
Nota
Hello,It's a Bitcoin Guide.
I'll check the movement since writing the analysis on September 12th.
This is the Nasdaq 30-minute chart.
I've marked the major sections with black fingers.
The light blue fingers indicate the short-to-long switching strategy.
The first section was touched at the top, and the second section, the long position switching section, was not touched, but instead broke through the top section.
It failed to reach the "good" section,
and a correction is occurring after the additional weekly candlestick was created this week.
Normaly,
it would have moved up and down once after touching the 1-hour chart support line,
but it rose without a wave and is now in the process of correction.
This is the Bitcoin 30-minute chart. I've marked the key sections with black fingers.
At the bottom left, the purple fingers are the same as the long position entry point at $113,531.5, which was the final entry point in the CPI analysis article on the 11th.
Similar to the Nasdaq, the light blue fingers are used in the short-to-long switching strategy.
After the first section -> $115,613.4 short position entry point,
it broke through the orange resistance line without a surge.
I cut my loss without falling to the lower level of 114.4K.
After trading sideways without significant movement over the weekend,
it touched the gap formed at the upper level of 116.1K,
and is now undergoing a correction along with the Nasdaq.
It touched the 4+6 section, rebounded, and is currently in a correction,
but it seems likely that it will continue to fluctuate up and down.
Please keep this in mind and practice principled trading.
Thank you.
Nota
Hello,It's a Bitcoin Guide.
I'll check the movement after writing the analysis on September 15th.
This is a 30-minute chart for the Nasdaq.
Key areas are marked with black fingers.
With the red finger long position strategy,
it ended with a vertical rise from 23,059.8 points.
A new high is being set at the top, reaching a great upward trend.
In the Nasdaq case, the 30+1 pattern held,
ending with a vertical rise without any fluctuations.
This is a 30-minute chart for Bitcoin.
Key areas are marked with black fingers.
With the red finger long position strategy,
it ended with a very sideways movement without breaking the green support line.
This morning, the purple finger at the top was $115,823.3.
A correction is underway after autonomous shorting and a rising wave.
It seems the direction will be determined only after the MACD dead cross on the 12-hour chart resolves.
Whether the upward trend continues despite this or a rebound after the correction appears to be influenced by the Nasdaq appears to be crucial.
I'll keep the strategy active and try again today.
Thank you.
Nota
Hello,It's a Bitcoin Guide.
I'll check the movement after writing the analysis on September 16th.
This is a 30-minute Bitcoin chart.
I've marked key areas with black fingers.
The top shows the short position entry point on the 15th.
The purple finger connects the $115,823.3 strategy.
*The red finger is the long position strategy.
At the bottom, the $114,695 long position switching point.
While it looks perfect at first glance,
it failed to touch the long position entry point by a $10.3 gap.
It rebounded cleanly from the target price of 115.8K, marked above, to the top, to the gap 8.
It's unfortunate, but the strategy has been canceled because it's either a slump or a failure.
When I conducted the analysis, the entry point should have been a bit lower, so I took my time, but it didn't come down and a rebound occurred. Haha.
I'm feeling disheartened, and
I'm starting to question the relevance of my analysis these days.
I can roughly predict the movement today,
but I hope everyone survives the FOMC.
Thank you.
Nota
Hello,It's a Bitcoin Guide.
Let's check out the FOMC analysis for September 17th.
s3.tradingview.com/snapshots/5/59EfSLrw.png
This is Bitcoin's 30-minute chart.
This is before the movement.
The red finger at the bottom was a long position waiting for $115,096.6.
The stop-loss was slightly looser at the light blue support line.
The long position target was $116,780.9 at the top -> the top level.
This is the movement after the analysis was written.
At 3:40 PM, the indicator release time shown,
exactly after entering a long position at $115,096.6,
the green support line remained intact, and the price reached 116.7K -> the top level.
It came out perfectly.
The strategy was to take profits. I was lucky yesterday too.
I hope you continue to operate safely today with principled trading.
Thank you.
Nota
Hello,It's a Bitcoin Guide.
I'll check the movement since writing the analysis on September 18th.
This is a 30-minute chart of the Nasdaq.
Key points are marked with black fingers.
In the red finger long position strategy,
after entering a long position at the bottom at 24,377.9 points,
it fell just short of the top point and ended in a sideways movement.
Unfortunately, it was a complete failure.
This is a 30-minute chart of Bitcoin.
Key points are marked with black fingers.
You can't see it in the bottom left,
but I connected the strategy after entering a long position at $115,096.6 on the 17th.
After a short position in Section 1 (indicated by the purple finger at the top),
the red finger indicates a long position waiting strategy.
After entering a short position at Section 1 at $117,494.7,
I switched to a long position at $116,942.5 at the bottom of the morning session.
The price continues to move sideways near the entry price.
After moving sideways without any fluctuations,
it then detoured and fell, so the strategy was manually liquidated.
It would have been nice if the Nasdaq had shown a slight trend.
That's a shame.
I hope you continue to operate with a disciplined trading strategy for the rest of the weekend.
Thank you.
Nota
Hello,It's a Bitcoin Guide.
I'll check the movement since the analysis was written on September 19th.
This is a 30-minute chart for the Nasdaq.
I've marked the key areas with black fingers.
This was a quick analysis for the management team.
The light blue fingers represent the short-to-long switching strategy.
After entering short at the top at 24,495.2 points,
the long position switching zone at the bottom didn't fall to 24.4K,
but rose to the top and closed.
This week, a new weekly candlestick was created and a correction is occurring.
Overall, the price moved sideways.
This is a 30-minute chart for Bitcoin.
I've marked the key areas with black fingers.
In the red finger long position strategy,
after entering a long position at $116,481.7,
it broke through the light blue support line
and a short stop loss was placed.
Last week, the strategy was essentially a chase buy at the risk zone of 1+4 digits.
The reason I placed a short stop loss was because the mid-term pattern, which had broken, was a second touch.
A separate strong decline occurred, separate from the Nasdaq.
As you can see, in any market,
you should always use your stop loss as a guideline and trade accordingly.
Over the weekend, the price moved sideways near the $115,238.2 level shown.
*After new daily and weekly candlesticks were formed this week,
after a retracement of the $115,366.2 level, which is the new gap level shown below,
a vertical decline occurred.
It fell to the $111,760.5 level shown at the bottom. This move broke the long-term pattern by touching the center line of the weekly Bollinger Band chart.
The Nasdaq is in an uptrend, but Bitcoin appears to have fallen sharply as the medium-term pattern, which broke the MACD danger signal, was pushed back to the next pattern.
The session has been held almost privately recently,
and participation is low, so I don't think the analysis will be meaningful,
so I'll jump in early.
I hope you do a good job, and I wish you the best.
Thank you.
*비트코인가이드 공식텔레그램 Telegram
t.me/BTG_Group
*빙엑스 BingX 50%DC+$5,000 (총1회수수료)
bingx.com/invite/YBM3A4
*바이비트 Bybit 20%DC+$5,020
partner.bybit.com/b/Bitcoin_Guide
*앞으로는 하단의 네이버카페에서만 활동합니다.
cafe.naver.com/loanlife82
t.me/BTG_Group
*빙엑스 BingX 50%DC+$5,000 (총1회수수료)
bingx.com/invite/YBM3A4
*바이비트 Bybit 20%DC+$5,020
partner.bybit.com/b/Bitcoin_Guide
*앞으로는 하단의 네이버카페에서만 활동합니다.
cafe.naver.com/loanlife82
Penerbitan berkaitan
Penafian
Maklumat dan penerbitan adalah tidak bertujuan, dan tidak membentuk, nasihat atau cadangan kewangan, pelaburan, dagangan atau jenis lain yang diberikan atau disahkan oleh TradingView. Baca lebih dalam Terma Penggunaan.