Hello
It's a Bitcoin Guide.
If you "follow"
You can receive real-time movement paths and comment notifications on major sections.
If my analysis was helpful,
Please click the booster button at the bottom.

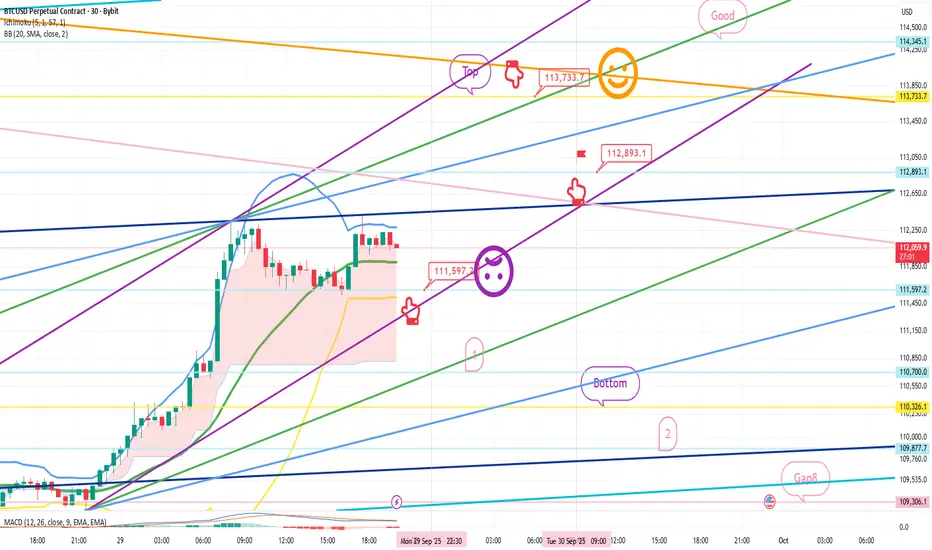
This is a Bitcoin 30-minute chart.
There are no Nasdaq indicators released today.
I developed a strategy based on the rising pattern.
*Red finger movement path:
One-way long position strategy
1. $111,597.2 long position entry point / Stop loss if the purple support line is broken
2. $113,733.7 long position first target -> Good second target
If the strategy is successful, the 112,8K level indicated
can be used as a long position re-entry point.
Up to the first section below, the price is moving sideways to the right.
From the bottom section touch, there's a high probability of a decline to the Gap 8 retracement level.
Please check the bottom support line and section 2 indicated below.
Up to this point,
I ask that you use my analysis for reference only.
I hope you operate safely, with a focus on principled trading and stop-loss orders.
Thank you.
It's a Bitcoin Guide.
If you "follow"
You can receive real-time movement paths and comment notifications on major sections.
If my analysis was helpful,
Please click the booster button at the bottom.
This is a Bitcoin 30-minute chart.
There are no Nasdaq indicators released today.
I developed a strategy based on the rising pattern.
*Red finger movement path:
One-way long position strategy
1. $111,597.2 long position entry point / Stop loss if the purple support line is broken
2. $113,733.7 long position first target -> Good second target
If the strategy is successful, the 112,8K level indicated
can be used as a long position re-entry point.
Up to the first section below, the price is moving sideways to the right.
From the bottom section touch, there's a high probability of a decline to the Gap 8 retracement level.
Please check the bottom support line and section 2 indicated below.
Up to this point,
I ask that you use my analysis for reference only.
I hope you operate safely, with a focus on principled trading and stop-loss orders.
Thank you.
Pesanan dibatalkan
Hello,It's a Bitcoin Guide.
I'll check the movement since writing the analysis on September 29th.
This is a 30-minute chart for the Nasdaq.
Key areas are marked with black fingers.
In the red finger long position strategy,
after an upward wave near the top,
we take a detour and enter a long position at 24.6K -> we close after touching area 2.
This morning, we touched the upper Bollinger Band,
and are moving sideways near the bottom.
Overall, we're moving sideways in a downward direction,
and the bullish pattern is breaking.
This is a 30-minute chart for Bitcoin.
Key areas are marked with black fingers.
In the lower left corner, the strategy was linked to the final long position entry point on September 25th, at $108,759.9.
In the red finger long position strategy,
it did not fall to the long position entry point of $111,597.2,
but connected with the Nasdaq at 10:30 AM,
resulting in a strong upward movement.
The target price at the top touched the Top -> Good range,
and a correction is in progress.
Since the entry point was not touched, the strategy has been canceled.
For those holding long positions on the 25th,
it rose by up to $6,000.
It would be a good idea to focus on the Nasdaq movement to see what kind of movement it will have today.
Thank you.
Nota
After entering a long position at $108,759.9 in Analysis #3 on the 25th,
the final target price reached the "Good" range at the top.
Nota
Hello,It's a Bitcoin Guide.
I'll check the movement since writing the analysis on September 30th.
This is a 30-minute chart of the Nasdaq.
I've marked key areas with black fingers.
The light blue finger indicates a short-to-long switching strategy.
After entering a short position at 24.6K, the orange resistance line was not broken,
-> switching to a long position at 23.5K, without breaking the green support line.
The price rebounded near the top and closed.
After a new daily candle was created today, a strong correction occurred,
and the price is now falling to the first area marked below.
Unfortunately, the perfect move was not achieved,
but most of the warning signals have been resolved.
This is a 30-minute chart of Bitcoin. I've marked key areas with black fingers.
In the bottom left, from the analysis on the 29th,
the purple finger indicates the long position re-entry point at $112,893.1.
I've followed the strategy exactly as it was.
After entering long at 112.8K,
while breaking through the purple support line,
the first vertical decline zone was broken.
The sky blue finger, in the short-to-long switching strategy,
touched the short position entry point at $14,005.1 at the top.
After reaching the short-term target price of $114,393.9, it closed in a very sideways range.
Today, as additional daily candles were formed,
it moved sideways and then broke through the orange resistance line.
Yesterday, the short-term pattern was broken when it touched the center line of the 2-hour Bollinger Bands,
but then it connected with the Nasdaq and suddenly surged.
Unfortunately, I was able to cut my losses with a pleasant feeling.
As indicated above, the price is rising strongly, reaching Top, Good, Great, and 116.5K.
For those of you who have been holding long positions since the analysis on the 29th,
it's rising to just under $4,000.
I told you it would continue to rise, didn't I?
Trend-following is so important.
So, I hope you continue to trade safely and consistently for the rest of the day.
Thank you.
Nota
Hello,It's a Bitcoin Guide.
I'll check the movement since writing the analysis on October 1st.
This is a 30-minute Bitcoin chart.
At the bottom left, the purple finger indicates the long position entry point on September 29th, at $112,893.1.
The strategy is still in progress.
In the red finger long position strategy,
the long position entry point at $115,632.2 continued to rise strongly without touching it.
After touching the short-term target price of $117,523.9,
at the first long position re-entry point at $116,914.7,
the long entry point was touched, and the price has been moving sideways since reaching the indicated Top -> Good level.
It's rising strongly,
but unfortunately, the entry point hasn't been touched,
so the strategy has been canceled.
After entering the long position in Section 1, the price is currently rising to around $2,600.
For future movements, please refer to the mid-term market situation video.
Have a happy holiday.
Thank you.
*비트코인가이드 공식텔레그램 Telegram
t.me/BTG_Group
*빙엑스 BingX 50%DC+$5,000 (총1회수수료)
bingx.com/invite/YBM3A4
*바이비트 Bybit 20%DC+$5,020
partner.bybit.com/b/Bitcoin_Guide
*앞으로는 하단의 네이버카페에서만 활동합니다.
cafe.naver.com/loanlife82
t.me/BTG_Group
*빙엑스 BingX 50%DC+$5,000 (총1회수수료)
bingx.com/invite/YBM3A4
*바이비트 Bybit 20%DC+$5,020
partner.bybit.com/b/Bitcoin_Guide
*앞으로는 하단의 네이버카페에서만 활동합니다.
cafe.naver.com/loanlife82
Penerbitan berkaitan
Penafian
Maklumat dan penerbitan adalah tidak bertujuan, dan tidak membentuk, nasihat atau cadangan kewangan, pelaburan, dagangan atau jenis lain yang diberikan atau disahkan oleh TradingView. Baca lebih dalam Terma Penggunaan.