🎯 BTC Hits Predicted 1.618 Fibonacci Target at $122K — What’s Next?
📅 Posted on: July 16, 2025
📍 Ticker: BTCUSD (BINANCE)
✍️ Author: darwas121
⸻
🔹 Summary
In October 2023, I shared a long-term bullish projection for Bitcoin (BTC/USD) targeting the 1.618 Fibonacci extension level — projected around $122,000. As of today, BTC has successfully hit this target, validating the Fibonacci-based wave structure and bull market thesis. Now the key question is — what’s next?
⸻
🧠 Prediction Recap (Oct 2023)
• ✅ Projected rally continuation based on wave structure + Fibonacci expansion
• ✅ Long-term target: $122,056 (1.618 Fib level)
• ✅ Based on swing low near $15,550 and prior ATH structure
• ✅ Conditions: Confirmed breakout above $81,500
⸻
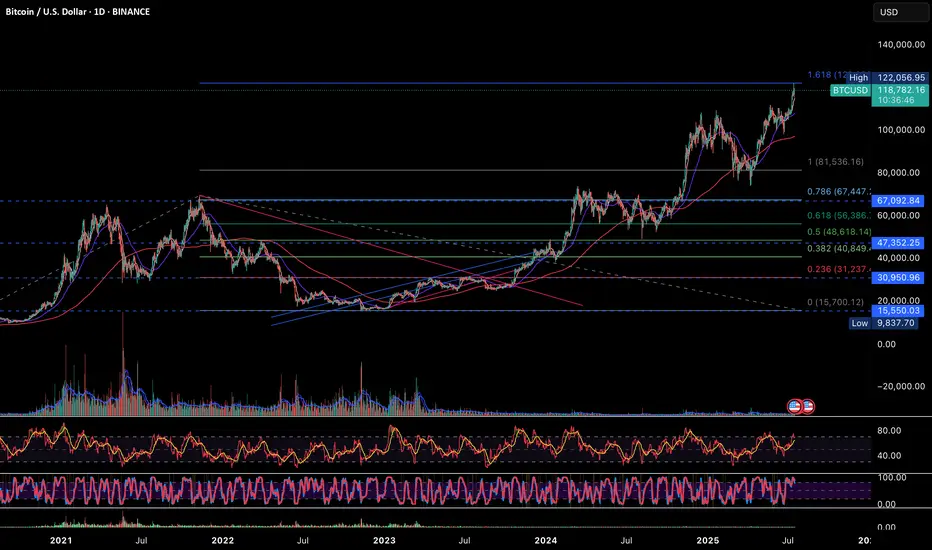
🔍 Current Technical Analysis (1D Chart)
💰 Price Action
• Current Price: $118,701
• Recent High: $122,056 (exact 1.618 Fib hit)
• Structure: Parabolic breakout from previous consolidation range
🔺 Fibonacci Levels
Level Price (USD)
0.236 31,237
0.382 40,849
0.5 48,618
0.618 56,386
0.786 67,092
1.0 (ATH Zone) 81,536
1.618 ✅ 122,056 (Hit)
📉 RSI & Momentum
• RSI is hovering in the overbought zone (>70), signaling potential cooling-off
• Stochastic RSI also indicates overextension — a pause or retracement could follow
• No bearish divergence yet, but watch closely
📊 Volume Trends
• Volume has tapered during this leg up — possible early sign of buyer exhaustion
• Previous volume clusters between $56k–$67k now act as strong support
⸻
⚠️ What to Watch Next
Risk Factors Notes
Overbought RSI Suggests short-term pullback risk
Weakening Volume Caution: Less conviction in highs
Parabolic Structure Vulnerability Break could mean fast correction
⸻
🧭 My View & Strategy
🔹 Short-Term: ⚠️ Cautious
• Book partial profits if holding from lower levels
• Watch for reversal candles near $122k zone
• RSI divergence or low-volume rally = yellow flag
🔹 Mid-Term: 🔼 Bullish
• Buy-the-dip zones: $67k (0.786) and $56k (0.618)
• Any correction into these zones may offer re-entry
🔹 Long-Term: 🔼 Strong Bullish
• BTC is in confirmed macro uptrend
• Sustained close above $122k opens price discovery zone
• Next logical Fib projection zones: $135k–$150k
⸻
📌 Key Levels
• Support: $81,536 / $67,092 / $56,386
• Resistance: $122,056 → Break = price discovery
• Invalidation Zone: Breakdown below $81,000 on volume
⸻
📣 Conclusion
The technical roadmap laid out in 2023 has now played out — Bitcoin has achieved its 1.618 Fibonacci extension target. We are now at a critical inflection point. If BTC consolidates well here and maintains volume, the next leg could launch us into new all-time highs beyond $135,000.
🛑 But caution is warranted — overbought signals + weak volume could bring a healthy correction first. Stick to your risk plan. Let the market come to you.
⸻
💬 Feel free to share your views or ask for updates in the comments.
🔔 Follow me for more swing-to-position analysis using volume, fibs & structure.
📊 Chart shared below for reference.
#Bitcoin #BTCUSD #Crypto #TechnicalAnalysis #Fibonacci #PriceTargets #CryptoForecast #ParabolicMove #BTC
📅 Posted on: July 16, 2025
📍 Ticker: BTCUSD (BINANCE)
✍️ Author: darwas121
⸻
🔹 Summary
In October 2023, I shared a long-term bullish projection for Bitcoin (BTC/USD) targeting the 1.618 Fibonacci extension level — projected around $122,000. As of today, BTC has successfully hit this target, validating the Fibonacci-based wave structure and bull market thesis. Now the key question is — what’s next?
⸻
🧠 Prediction Recap (Oct 2023)
• ✅ Projected rally continuation based on wave structure + Fibonacci expansion
• ✅ Long-term target: $122,056 (1.618 Fib level)
• ✅ Based on swing low near $15,550 and prior ATH structure
• ✅ Conditions: Confirmed breakout above $81,500
⸻
🔍 Current Technical Analysis (1D Chart)
💰 Price Action
• Current Price: $118,701
• Recent High: $122,056 (exact 1.618 Fib hit)
• Structure: Parabolic breakout from previous consolidation range
🔺 Fibonacci Levels
Level Price (USD)
0.236 31,237
0.382 40,849
0.5 48,618
0.618 56,386
0.786 67,092
1.0 (ATH Zone) 81,536
1.618 ✅ 122,056 (Hit)
📉 RSI & Momentum
• RSI is hovering in the overbought zone (>70), signaling potential cooling-off
• Stochastic RSI also indicates overextension — a pause or retracement could follow
• No bearish divergence yet, but watch closely
📊 Volume Trends
• Volume has tapered during this leg up — possible early sign of buyer exhaustion
• Previous volume clusters between $56k–$67k now act as strong support
⸻
⚠️ What to Watch Next
Risk Factors Notes
Overbought RSI Suggests short-term pullback risk
Weakening Volume Caution: Less conviction in highs
Parabolic Structure Vulnerability Break could mean fast correction
⸻
🧭 My View & Strategy
🔹 Short-Term: ⚠️ Cautious
• Book partial profits if holding from lower levels
• Watch for reversal candles near $122k zone
• RSI divergence or low-volume rally = yellow flag
🔹 Mid-Term: 🔼 Bullish
• Buy-the-dip zones: $67k (0.786) and $56k (0.618)
• Any correction into these zones may offer re-entry
🔹 Long-Term: 🔼 Strong Bullish
• BTC is in confirmed macro uptrend
• Sustained close above $122k opens price discovery zone
• Next logical Fib projection zones: $135k–$150k
⸻
📌 Key Levels
• Support: $81,536 / $67,092 / $56,386
• Resistance: $122,056 → Break = price discovery
• Invalidation Zone: Breakdown below $81,000 on volume
⸻
📣 Conclusion
The technical roadmap laid out in 2023 has now played out — Bitcoin has achieved its 1.618 Fibonacci extension target. We are now at a critical inflection point. If BTC consolidates well here and maintains volume, the next leg could launch us into new all-time highs beyond $135,000.
🛑 But caution is warranted — overbought signals + weak volume could bring a healthy correction first. Stick to your risk plan. Let the market come to you.
⸻
💬 Feel free to share your views or ask for updates in the comments.
🔔 Follow me for more swing-to-position analysis using volume, fibs & structure.
📊 Chart shared below for reference.
#Bitcoin #BTCUSD #Crypto #TechnicalAnalysis #Fibonacci #PriceTargets #CryptoForecast #ParabolicMove #BTC
Penafian
Maklumat dan penerbitan adalah tidak dimaksudkan untuk menjadi, dan tidak membentuk, nasihat untuk kewangan, pelaburan, perdagangan dan jenis-jenis lain atau cadangan yang dibekalkan atau disahkan oleh TradingView. Baca dengan lebih lanjut di Terma Penggunaan.
Penafian
Maklumat dan penerbitan adalah tidak dimaksudkan untuk menjadi, dan tidak membentuk, nasihat untuk kewangan, pelaburan, perdagangan dan jenis-jenis lain atau cadangan yang dibekalkan atau disahkan oleh TradingView. Baca dengan lebih lanjut di Terma Penggunaan.