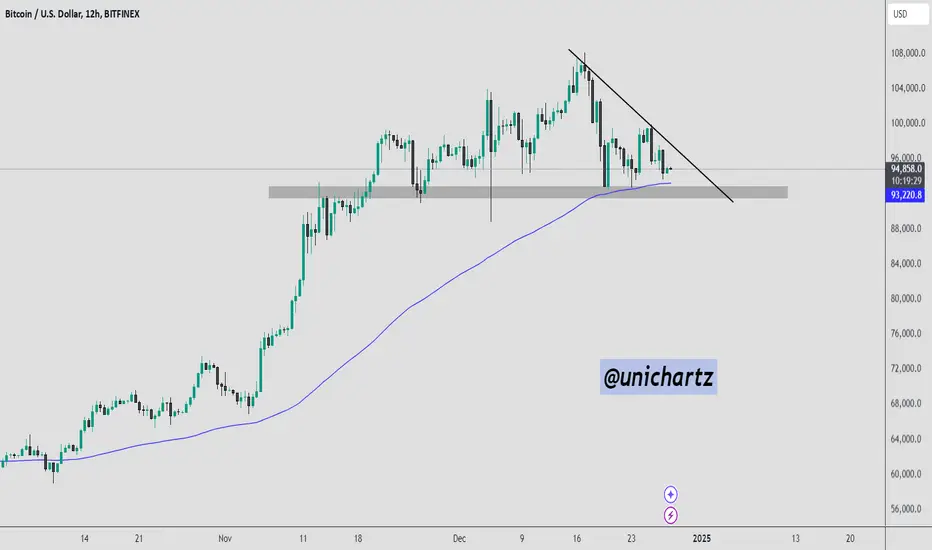
Bitcoin is currently trading near $94,500, resting on a strong confluence of support. The price is testing the 100 EMA on the 12-hour chart, which aligns with a critical horizontal support zone around $93,000. At the same time, a descending trendline is acting as resistance, keeping the price under pressure.
A breakdown below the marked support zone could trigger a sharp decline toward the next significant level around $88,000. On the other hand, if BTC holds this support and breaks above the descending trendline, it could signal a bullish reversal, pushing the price back toward $98,000 and potentially higher.
A breakdown below the marked support zone could trigger a sharp decline toward the next significant level around $88,000. On the other hand, if BTC holds this support and breaks above the descending trendline, it could signal a bullish reversal, pushing the price back toward $98,000 and potentially higher.
Penafian
Maklumat dan penerbitan adalah tidak dimaksudkan untuk menjadi, dan tidak membentuk, nasihat untuk kewangan, pelaburan, perdagangan dan jenis-jenis lain atau cadangan yang dibekalkan atau disahkan oleh TradingView. Baca dengan lebih lanjut di Terma Penggunaan.
Penafian
Maklumat dan penerbitan adalah tidak dimaksudkan untuk menjadi, dan tidak membentuk, nasihat untuk kewangan, pelaburan, perdagangan dan jenis-jenis lain atau cadangan yang dibekalkan atau disahkan oleh TradingView. Baca dengan lebih lanjut di Terma Penggunaan.
