TL;DR
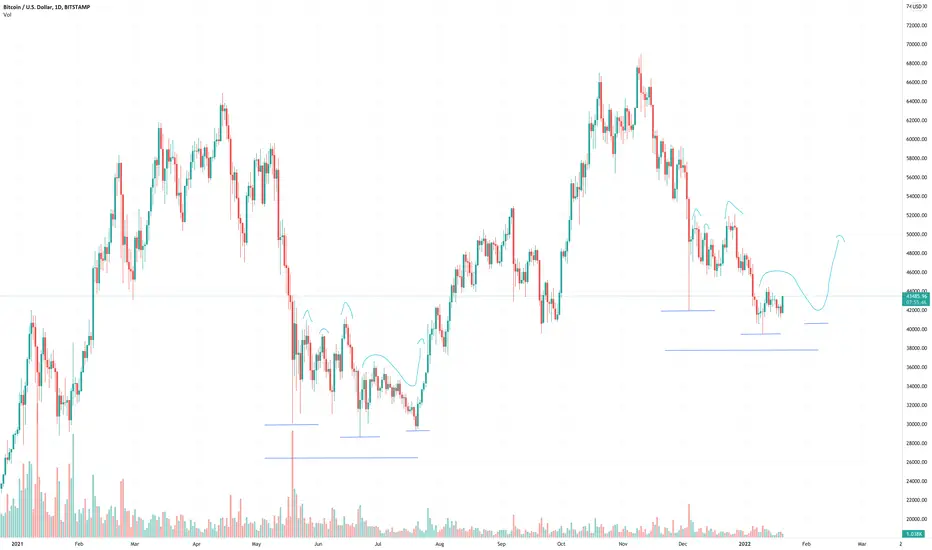
June/July of 2021 and December/January of 2022 have the following notable similarities:
- One big flash dip
- 3 mini peaks followed by a further dip (Bottom)
- Recovery and sideways action before *one final dip somewhere in between both of the lowest wicks*(still to come)
While looking far and wide for some hopium during the latest dip, I decided to check the daily charts from the crash in May/June/July and noticed some similarities between both.
By no means is this truly TA but similarities in both dips may cause them to play out in the same way - if that's the case, the worst is over and I'm anticipating a dip to $40.5k around the 7th-15th of February before a rally.
Will keep an eye on this and update as the days go on.
Nota
LolPenafian
Maklumat dan penerbitan adalah tidak dimaksudkan untuk menjadi, dan tidak membentuk, nasihat untuk kewangan, pelaburan, perdagangan dan jenis-jenis lain atau cadangan yang dibekalkan atau disahkan oleh TradingView. Baca dengan lebih lanjut di Terma Penggunaan.
Penafian
Maklumat dan penerbitan adalah tidak dimaksudkan untuk menjadi, dan tidak membentuk, nasihat untuk kewangan, pelaburan, perdagangan dan jenis-jenis lain atau cadangan yang dibekalkan atau disahkan oleh TradingView. Baca dengan lebih lanjut di Terma Penggunaan.