XUANHAIMMOER come back in today ***
Hi guy, keep continuing update about Bitcoin from last few days. I focus on comparing and finding similar action of market with same psychology in history for showing where we are in cycle with evidences.
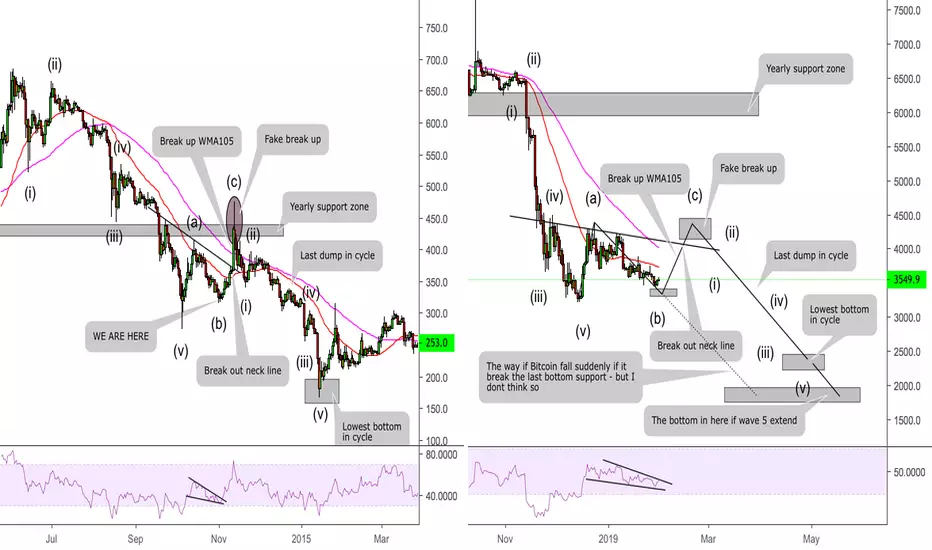
As many post I show for you where we are right now but today I zoom the chart and declare more detail with Elliot and similar aspects.
I will public again some last post of me with total comparing 2014-2015 with 2018-2019 in below this post.
Now look at 2 different part in above, using Elliot and we are easy to find where we are right now, ok ? ( Remember, this is my opinion I explain in many post before not right now so get it as reference, I do not take any responsibility with your money )
If comparing, we see that we are in the end of wave B and next is wave C - up correction.
We nearly have double bottom in here. In next recent time , we will break up WMA49 and WMA105 and fake break up neck line in 2 similar periods.
After we have fake break up, we have strong dump to the lowest bottom zone. AS this time I predict is 2300 - 2400$ but if wave 5 is extend so we may see the wick of daily nearly with 1900$
So what about the situation if we break down the last support zone in 32xx$, we may have very terrible after that. But as my opinion I vote for pull back before dropping.
RSI in different period also be bull flag pattern and similar.
LIKE and Comment your idea in below this post - Thank so much
~~~ XUANHAIMMOER ~~~
Hi guy, keep continuing update about Bitcoin from last few days. I focus on comparing and finding similar action of market with same psychology in history for showing where we are in cycle with evidences.
As many post I show for you where we are right now but today I zoom the chart and declare more detail with Elliot and similar aspects.
I will public again some last post of me with total comparing 2014-2015 with 2018-2019 in below this post.
Now look at 2 different part in above, using Elliot and we are easy to find where we are right now, ok ? ( Remember, this is my opinion I explain in many post before not right now so get it as reference, I do not take any responsibility with your money )
If comparing, we see that we are in the end of wave B and next is wave C - up correction.
We nearly have double bottom in here. In next recent time , we will break up WMA49 and WMA105 and fake break up neck line in 2 similar periods.
After we have fake break up, we have strong dump to the lowest bottom zone. AS this time I predict is 2300 - 2400$ but if wave 5 is extend so we may see the wick of daily nearly with 1900$
So what about the situation if we break down the last support zone in 32xx$, we may have very terrible after that. But as my opinion I vote for pull back before dropping.
RSI in different period also be bull flag pattern and similar.
LIKE and Comment your idea in below this post - Thank so much
~~~ XUANHAIMMOER ~~~
Nota
We consider in weekly chartNota
BITCOIN - WHERE WE ARE IN CYCLE ? - LONG TERM ANALYSIS
Nota
If you zoom, the position we are staying so we may see similar big bullish flag and include numerous bearish flag in big pattern like this:Nota
This is some explain for all you what happen if we compare with 2014-2015:After ABC correction wave - pull back, we may have downtrend parallel channel with many bearish flag insight. Detail in here
Nota
We may have Bear Flag pattern in 1H chartNota
Nota
Bitcoin analysis with trading system
Nota
Going up very success ! Congrate !Nota
Nearly touched target zone ! Congrateful !Dagangan ditutup: sasaran tercapai
Penafian
Maklumat dan penerbitan adalah tidak dimaksudkan untuk menjadi, dan tidak membentuk, nasihat untuk kewangan, pelaburan, perdagangan dan jenis-jenis lain atau cadangan yang dibekalkan atau disahkan oleh TradingView. Baca dengan lebih lanjut di Terma Penggunaan.
Penafian
Maklumat dan penerbitan adalah tidak dimaksudkan untuk menjadi, dan tidak membentuk, nasihat untuk kewangan, pelaburan, perdagangan dan jenis-jenis lain atau cadangan yang dibekalkan atau disahkan oleh TradingView. Baca dengan lebih lanjut di Terma Penggunaan.