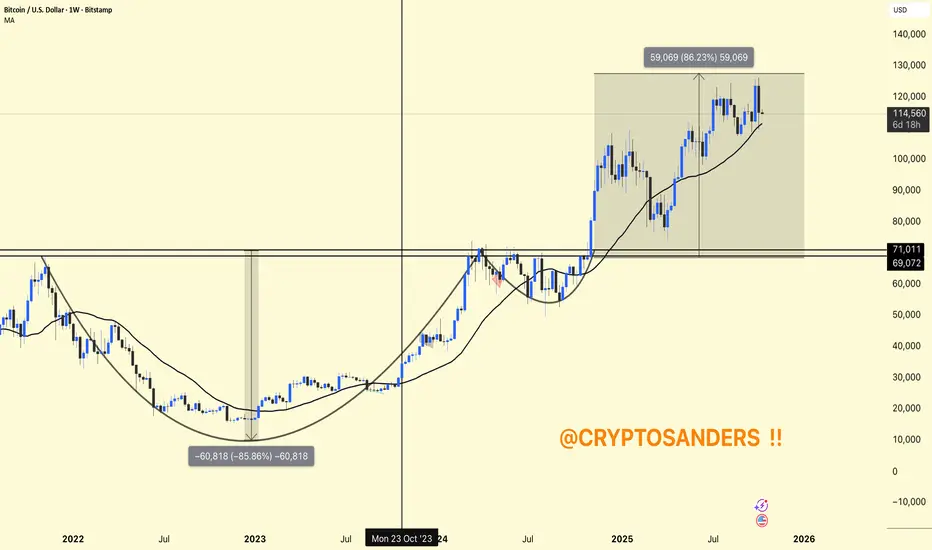
BTC/USDT Weekly Chart
Structure: The chart shows a complete market cycle – a deep correction (approximately -85%), followed by a strong recovery and breakout.
Current Area: Bitcoin is trading around $114K–$115K, holding above the 111K weekly MA (support).
Previous Resistance: The $69K–$71K area (old ATH) has now turned into a strong support zone.
Upward Momentum: From the breakout point (~$71K) to the recent high (~$130K), BTC gained approximately +86%, indicating strong bullish momentum.
Perspective: As long as the price remains above the $111K MA and does not lose support at $100K, the overall trend will remain bullish, and a retest of $130K–$135K is possible.
DYOR | NFA
Penerbitan berkaitan
Penafian
Maklumat dan penerbitan adalah tidak dimaksudkan untuk menjadi, dan tidak membentuk, nasihat untuk kewangan, pelaburan, perdagangan dan jenis-jenis lain atau cadangan yang dibekalkan atau disahkan oleh TradingView. Baca dengan lebih lanjut di Terma Penggunaan.
Penerbitan berkaitan
Penafian
Maklumat dan penerbitan adalah tidak dimaksudkan untuk menjadi, dan tidak membentuk, nasihat untuk kewangan, pelaburan, perdagangan dan jenis-jenis lain atau cadangan yang dibekalkan atau disahkan oleh TradingView. Baca dengan lebih lanjut di Terma Penggunaan.