There has been a lot of talk about the bullish divergence that has been occuring on BTCUSD and many top coins and I have participated in those discussions. But it is become clear to me that large triangles, whether they be continuation patterns or reversal patterns, will have the MACD start to drift towards the zero line. Which makes sense, it is a Moving Average Convergence/Divergence indicator and if the price action is narrowing in on a point the moving averages will also both be converging on ZERO.
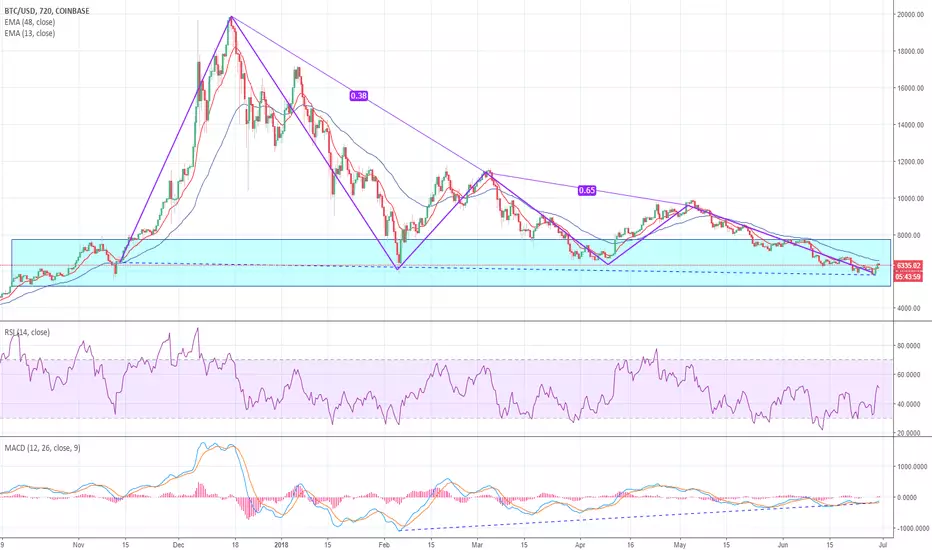
THe shaded box has been a critical area of support and resistance since October. We peaked above that box several times but we have been drawn back or stuck in the box for three quarters of a year now. The MACD values on the various timeframes are tightening on zero because we have been range bound and are consolidating at that level.
Range bound price action often breaks one way or the other quite impulsively and I do think you can count on bullish divergence on the daily or micro timeframes to time some swing trades. But the larger picture is still bearish. The price of Bitcoin is theoretically linked to its adoption under Metcalfe's Law (medium.com/@clearblocks/valuing-bitcoin-and-ethereum-with-metcalfes-law-aaa743f469f6) so we should always get our strongest signals from the log chart, and we see rejection at the log resistance line in blue below.

Below we see the monthly log chart with a ichimoku cloud (standard settings) and it seems very strongly to me that we will go back down and we very well may peirce through the cloud and it will start acting as resistance, not support. Also, when dealing with stock bubbles you have to go below the mean line. The correction down always has to be more than you would expect. This is how you truly buy the dip, on the macro timeframe and not the daily or micro time frames.

Link to phases of a bubble:
static.seekingalpha.com/uploads/2018/1/23/48558512-15167626365862508_origin.png
THe shaded box has been a critical area of support and resistance since October. We peaked above that box several times but we have been drawn back or stuck in the box for three quarters of a year now. The MACD values on the various timeframes are tightening on zero because we have been range bound and are consolidating at that level.
Range bound price action often breaks one way or the other quite impulsively and I do think you can count on bullish divergence on the daily or micro timeframes to time some swing trades. But the larger picture is still bearish. The price of Bitcoin is theoretically linked to its adoption under Metcalfe's Law (medium.com/@clearblocks/valuing-bitcoin-and-ethereum-with-metcalfes-law-aaa743f469f6) so we should always get our strongest signals from the log chart, and we see rejection at the log resistance line in blue below.
Below we see the monthly log chart with a ichimoku cloud (standard settings) and it seems very strongly to me that we will go back down and we very well may peirce through the cloud and it will start acting as resistance, not support. Also, when dealing with stock bubbles you have to go below the mean line. The correction down always has to be more than you would expect. This is how you truly buy the dip, on the macro timeframe and not the daily or micro time frames.
Link to phases of a bubble:
static.seekingalpha.com/uploads/2018/1/23/48558512-15167626365862508_origin.png
Nota
The surge that is ending the day has not been able to get past the short term overhead log resistance line and is certainly no where near the long term resistance line in play since early mayWe see much of the same condition from the normal overhead resistance lines. The short term line is essentially the same whether it is drawn arithmetically or logarithmically. I moved the arithmetic overhead resistance line from the peak in early may to late May because it is a better fit and we can see we still have lots of room. My gut and recent experience tells me this will be a short lived rally.
What we see on ETHUSD is mirrored rather closely on BTCUSD with the log resistance lines appearing to be the controlling factor in play. With BTCUSD we might see a 15% drop to support, and that is not including wicking.
We have to break out of these downtrend sometimes but with what I see on the weekly and monthly charts as well as the micro-timeframes I don't see it happening soon in a sustained manner.
Nota
Off to bed but the log resistance lines have held strong all day and I suspect they will keep on doing so. I an still expecting a precipitous drop once this gets going. Below is the 45 minute chart and I think the RSI will generally decline before it completely rolls over. At that time the MACD should drop almost straight down.No TA is perfect but my confidence is pretty high with the totality of what we are seeing. The resistance line has been respected and the indicators are doing what they should. I would not be surprised if we saw a "needle" surge up past the resistance line and then the price break down. There is a very slight chance, in my estimation, that needle pop would carry on but I really don't think so.
Nota
Oops, that was ETHSUSD, here is BTCUSD. Same explanation applies.And I promise every Floridian that you will all be rich... because we're gonna print some more money! Why didn't anybody ever think of this before?
~Nathan Explosion
~Nathan Explosion
Penafian
Maklumat dan penerbitan adalah tidak dimaksudkan untuk menjadi, dan tidak membentuk, nasihat untuk kewangan, pelaburan, perdagangan dan jenis-jenis lain atau cadangan yang dibekalkan atau disahkan oleh TradingView. Baca dengan lebih lanjut di Terma Penggunaan.
Penafian
Maklumat dan penerbitan adalah tidak dimaksudkan untuk menjadi, dan tidak membentuk, nasihat untuk kewangan, pelaburan, perdagangan dan jenis-jenis lain atau cadangan yang dibekalkan atau disahkan oleh TradingView. Baca dengan lebih lanjut di Terma Penggunaan.