7 July 2021
I'll try to keep it as short as possible, here's my analysis of the current situation;
Whats the outcome? If we breakdown back into the downtrend channel, and make a HL, its likely to fall through the 30k support and start the bear market. If we find support above the 0.618 FIB from recent low (28.8k), to recent high (36.6k), we're likely to test 43k in the next 1-2 weeks from now. And from there, its likely to re-enter the bull market.
Link to the 4 images: imgur.com/a/HIyxxvD
s3.tradingview.com/snapshots/j/JK2wdiM2.png
1. FIB retracement with support & resistance lines (1 hour TF)
explaination: Candles closing below the line of a FIB level is very bearish. Traders are speculating for a bearish elliot impulse wave (cleary visible on the daily time frame, fall to 20K & below, likely starting the bear market). However, once we find solid support on the 0.618 FIB, then that theory is unlikely to happen, and we will continue the bull market for X amount of time.
s3.tradingview.com/snapshots/f/f3pNT8Ob.png
2. heads & shoulder (bullish scenario) (1 hour TF)
s3.tradingview.com/snapshots/q/qQQLioyN.png
3. ichimoku cloud resistance, excluded lines for clarity (20 60 120 30) (4 hour TF)
we've passed through this % of resistance before (when we made a higher high to ~41k)
with a "weak" EMA ribbon (tighter ribbon iseasier to pass-through) (previously passed through to the 41k swing)
s3.tradingview.com/snapshots/t/T0t1dTUU.png
4. ichimoku cloud gap (1 hour TF)
My general analysis approach:
- Gather fundametals of asset
- Financialjuice.com for FUD / FOMO (catalysts) & research exposure & creditbility of such news, i.e. countries adopting cryptocurrency
- Hashrate chart, bitcoin explorer for whale wallet tracking, longs & shorts tracking, tracking tradtional stock charts for movements affecting crypto (dollar, S&P 500 etc)
- Weekly => Daily => 4h => 1h => 15m timeframe analysis
I'm using market cipher with deviations (RSI + stoch rsi + wavetrend + MFI & various signals), EMA ribbon, ichimoku cloud, and a 20 & 50 SMA occasionally. Market cipher is incredibly useful for detecting fakeouts and market swings, its my go-to TA indicator.
First, I like to use EMA ribbon on the longer timeframes to spot potential market direction changes. For timeframes below daily, its useful for determining the strength of the dominant team (supply / demand) (bears / bulls).
Secondly, I use the ichimoku cloud for support / resistances strength, and use it for entries along with Market cipher. I use the 20 & 50 SMA (not too often) in an unorthodox way, by calculating the length of swings, for a better overall understanding of whos in control, or about to lose control. Helps with indicating higher lows / lower lows. I draw simple trendlines for support & resistance, use FIB retracement, and draw paralell channels to track general trend breakouts.
Volume visible range is useful aswel, although I rarely use it. Once a market reaches certain price milestones, it becomes volatile & gets a lot of support outweighing whatever resistance / support is shown. I prefer to keep track of the point of control, news, and other factors that affect investor's incentives.
I'll try to keep it as short as possible, here's my analysis of the current situation;
- Lots of FUD (largest crypto exchange under fire, china ban etc)
- Lots of FOMO (countries adopting crypto etc)
- Chart shows all-out-war between bears & bulls, bears want it back in the downtrend channel that started at the crash in May, while bulls are defending the line. And its happening during a weekend.
Whats the outcome? If we breakdown back into the downtrend channel, and make a HL, its likely to fall through the 30k support and start the bear market. If we find support above the 0.618 FIB from recent low (28.8k), to recent high (36.6k), we're likely to test 43k in the next 1-2 weeks from now. And from there, its likely to re-enter the bull market.
Link to the 4 images: imgur.com/a/HIyxxvD
s3.tradingview.com/snapshots/j/JK2wdiM2.png
1. FIB retracement with support & resistance lines (1 hour TF)
explaination: Candles closing below the line of a FIB level is very bearish. Traders are speculating for a bearish elliot impulse wave (cleary visible on the daily time frame, fall to 20K & below, likely starting the bear market). However, once we find solid support on the 0.618 FIB, then that theory is unlikely to happen, and we will continue the bull market for X amount of time.
s3.tradingview.com/snapshots/f/f3pNT8Ob.png
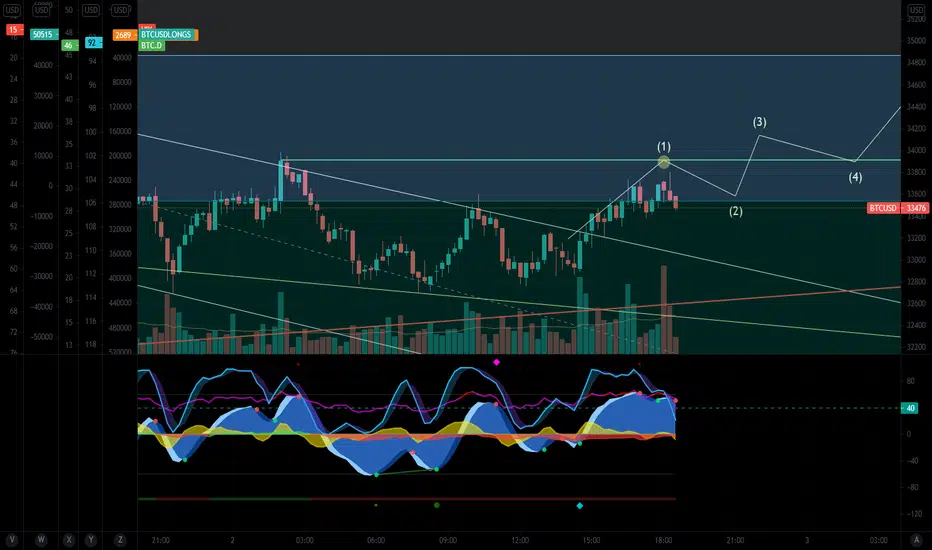
2. heads & shoulder (bullish scenario) (1 hour TF)
s3.tradingview.com/snapshots/q/qQQLioyN.png
3. ichimoku cloud resistance, excluded lines for clarity (20 60 120 30) (4 hour TF)
we've passed through this % of resistance before (when we made a higher high to ~41k)
with a "weak" EMA ribbon (tighter ribbon iseasier to pass-through) (previously passed through to the 41k swing)
s3.tradingview.com/snapshots/t/T0t1dTUU.png
4. ichimoku cloud gap (1 hour TF)
My general analysis approach:
- Gather fundametals of asset
- Financialjuice.com for FUD / FOMO (catalysts) & research exposure & creditbility of such news, i.e. countries adopting cryptocurrency
- Hashrate chart, bitcoin explorer for whale wallet tracking, longs & shorts tracking, tracking tradtional stock charts for movements affecting crypto (dollar, S&P 500 etc)
- Weekly => Daily => 4h => 1h => 15m timeframe analysis
I'm using market cipher with deviations (RSI + stoch rsi + wavetrend + MFI & various signals), EMA ribbon, ichimoku cloud, and a 20 & 50 SMA occasionally. Market cipher is incredibly useful for detecting fakeouts and market swings, its my go-to TA indicator.
First, I like to use EMA ribbon on the longer timeframes to spot potential market direction changes. For timeframes below daily, its useful for determining the strength of the dominant team (supply / demand) (bears / bulls).
Secondly, I use the ichimoku cloud for support / resistances strength, and use it for entries along with Market cipher. I use the 20 & 50 SMA (not too often) in an unorthodox way, by calculating the length of swings, for a better overall understanding of whos in control, or about to lose control. Helps with indicating higher lows / lower lows. I draw simple trendlines for support & resistance, use FIB retracement, and draw paralell channels to track general trend breakouts.
Volume visible range is useful aswel, although I rarely use it. Once a market reaches certain price milestones, it becomes volatile & gets a lot of support outweighing whatever resistance / support is shown. I prefer to keep track of the point of control, news, and other factors that affect investor's incentives.
Nota
snapshots: imgur.com/a/HIyxxvDNota
Support is decent, despite weekends being infamous for low liquidity. Will have to observe & wait for more volume.I personally wont take a long position yet, till it hits my goal at the yellow highlighted dot (33.9k), and finds support at 0.618 FIB.
Penafian
Maklumat dan penerbitan adalah tidak dimaksudkan untuk menjadi, dan tidak membentuk, nasihat untuk kewangan, pelaburan, perdagangan dan jenis-jenis lain atau cadangan yang dibekalkan atau disahkan oleh TradingView. Baca dengan lebih lanjut di Terma Penggunaan.
Penafian
Maklumat dan penerbitan adalah tidak dimaksudkan untuk menjadi, dan tidak membentuk, nasihat untuk kewangan, pelaburan, perdagangan dan jenis-jenis lain atau cadangan yang dibekalkan atau disahkan oleh TradingView. Baca dengan lebih lanjut di Terma Penggunaan.