Technical Analysis and Outlook:
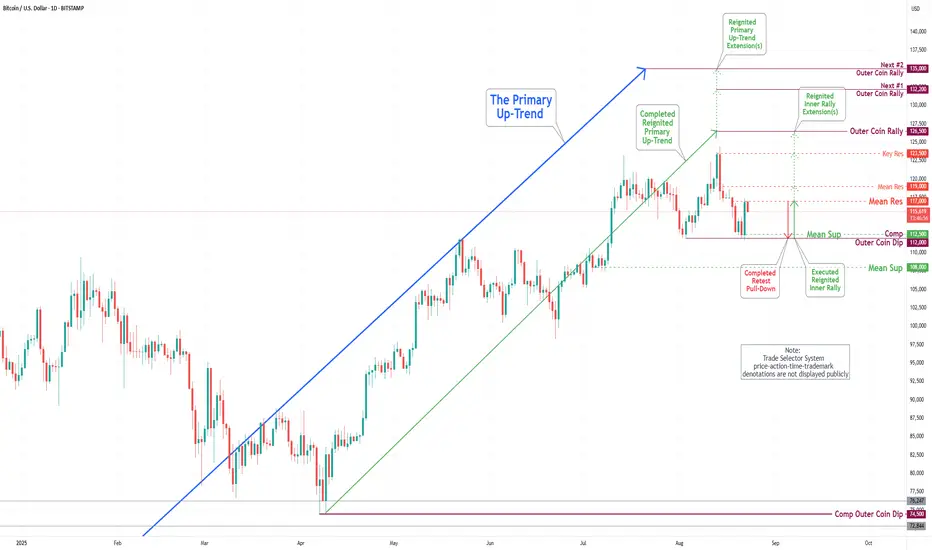
During the current trading session, the Bitcoin market has experienced a noteworthy pullback to the completed Outer Coin Dip at 112000, and as a result, has demonstrated considerable resilience, reaching the Mean Resistance (the inverse of Mean Support) at 116600 as detailed in the Daily Chart Analysis for the week of August 15. The prevailing analysis suggests that the cryptocurrency may revisit the Mean Support at 116500, as well as the completed Outer Coin Dip at 112000, before resuming its bullish trend.
During the current trading session, the Bitcoin market has experienced a noteworthy pullback to the completed Outer Coin Dip at 112000, and as a result, has demonstrated considerable resilience, reaching the Mean Resistance (the inverse of Mean Support) at 116600 as detailed in the Daily Chart Analysis for the week of August 15. The prevailing analysis suggests that the cryptocurrency may revisit the Mean Support at 116500, as well as the completed Outer Coin Dip at 112000, before resuming its bullish trend.
Penerbitan berkaitan
Penafian
Maklumat dan penerbitan adalah tidak dimaksudkan untuk menjadi, dan tidak membentuk, nasihat untuk kewangan, pelaburan, perdagangan dan jenis-jenis lain atau cadangan yang dibekalkan atau disahkan oleh TradingView. Baca dengan lebih lanjut di Terma Penggunaan.
Penerbitan berkaitan
Penafian
Maklumat dan penerbitan adalah tidak dimaksudkan untuk menjadi, dan tidak membentuk, nasihat untuk kewangan, pelaburan, perdagangan dan jenis-jenis lain atau cadangan yang dibekalkan atau disahkan oleh TradingView. Baca dengan lebih lanjut di Terma Penggunaan.