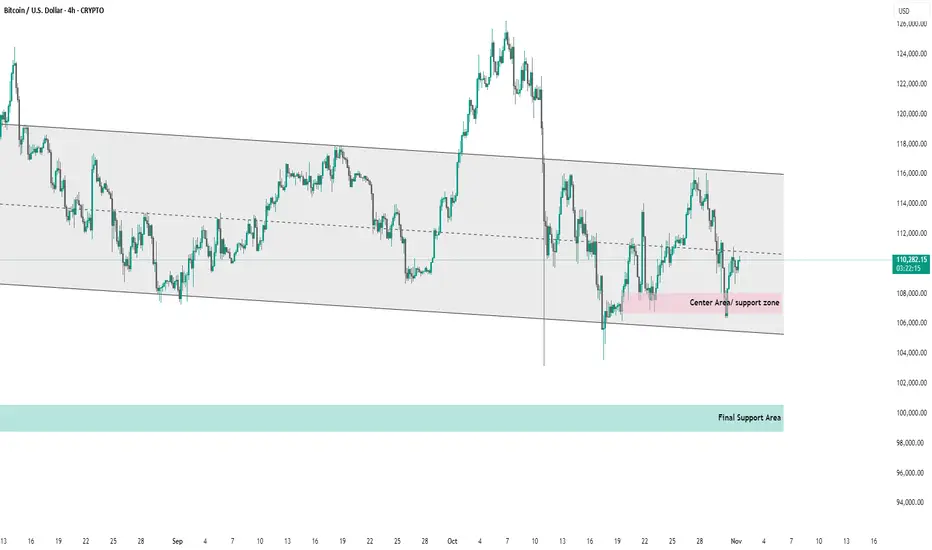
chart shows Bitcoin (BTC/USD) on the 4-hour timeframe within a descending channel pattern.
Key observations:
Channel Trend: BTC is trading inside a downward-sloping channel, indicating a medium-term bearish structure.
Current Price: Around $110,292.
Center Area / Support Zone: Highlighted in pink (~$107,000–$109,000) — acting as a short-term support or potential bounce region.
Final Support Area: Marked in green (~$98,000–$100,000) — a critical demand zone where strong buying interest may appear if price breaks below the current support.
Summary:
Bitcoin remains in a downward channel, consolidating near mid-support. A rebound from the pink zone could target the channel’s midline or upper boundary, while a break below $107,000 might lead to a test of the final support area near $100,000.
Penerbitan berkaitan
Penafian
Maklumat dan penerbitan adalah tidak bertujuan, dan tidak membentuk, nasihat atau cadangan kewangan, pelaburan, dagangan atau jenis lain yang diberikan atau disahkan oleh TradingView. Baca lebih dalam Terma Penggunaan.
Penerbitan berkaitan
Penafian
Maklumat dan penerbitan adalah tidak bertujuan, dan tidak membentuk, nasihat atau cadangan kewangan, pelaburan, dagangan atau jenis lain yang diberikan atau disahkan oleh TradingView. Baca lebih dalam Terma Penggunaan.